Agents designed by experts, figures computed by versioned engines, and every result recomputed by a reviewer that did none of the work. The method, as questions and answers.
Edition 1.2 · Revised 2026-10-20 · 49 questions in 10 parts
What's new
20 October 2026 Every answer, list and figure was rewritten so that it reads in complete sentences and uses one plain term for each idea. Q23 now explains in one place where a measure cost comes from, in six numbered source levels. Q25 places those costs in an AACE International estimate class. The costing questions sit together in Part E, and the questions are numbered in the order they appear, so questions after Q23 have new numbers. Two statements were corrected against the tools: a cost is brought to current prices, not to its install year, and a cost has a low and high range only where its source gives one.
13 October 2026 US regional cost pricing now applies only cited location factors. Where a state or city construction wage ratio is on record, it adjusts the labor share of a cost, and material and equipment stay at national cost. Uncited regional estimates are no longer applied (Q23, Q24, Q49).
8 October 2026 Edition 1.1 added Part I, which covers measure selection, utility escalation, electrification and the grid, and the financial calculations, with two cashflow exhibits. It also added Part J, which covers the quality checks, common data problems, when to question a result, sensitivity to missing inputs and known limitations.
4 October 2026 An input taken from a client document, a recorded decision or an observation now carries its citation in the estimated-inputs record. An input whose plausibility check was written after its value was chosen is labelled as carried and is never backdated (Q47).
30 September 2026 The price index used to bring costs to current prices is now read from the reviewed reference library on every use. If it cannot be read, the cost is not adjusted and stored values are never used instead (Q24).
27 September 2026 Canadian locations are now priced from cited location factors and converted at the Bank of Canada annual exchange rate. A location without a cited factor is not priced (Q24).
20 September 2026 The quality review now checks calibration fuel by fuel, after models were found that matched a building's total bills only because errors in different fuels cancelled out (Q46).
Part A
What a deliverable provides and how far to rely on it
This part explains what a Soapbox deliverable is, who it serves, and how far it can be relied on.
Soapbox turns a building's or a portfolio's documents and data into analyses that support capital decisions, through a range of workflows.
The workflows cover capital plans, energy audits, acquisition screens, risk screens, portfolio summaries and more, and the library is growing.
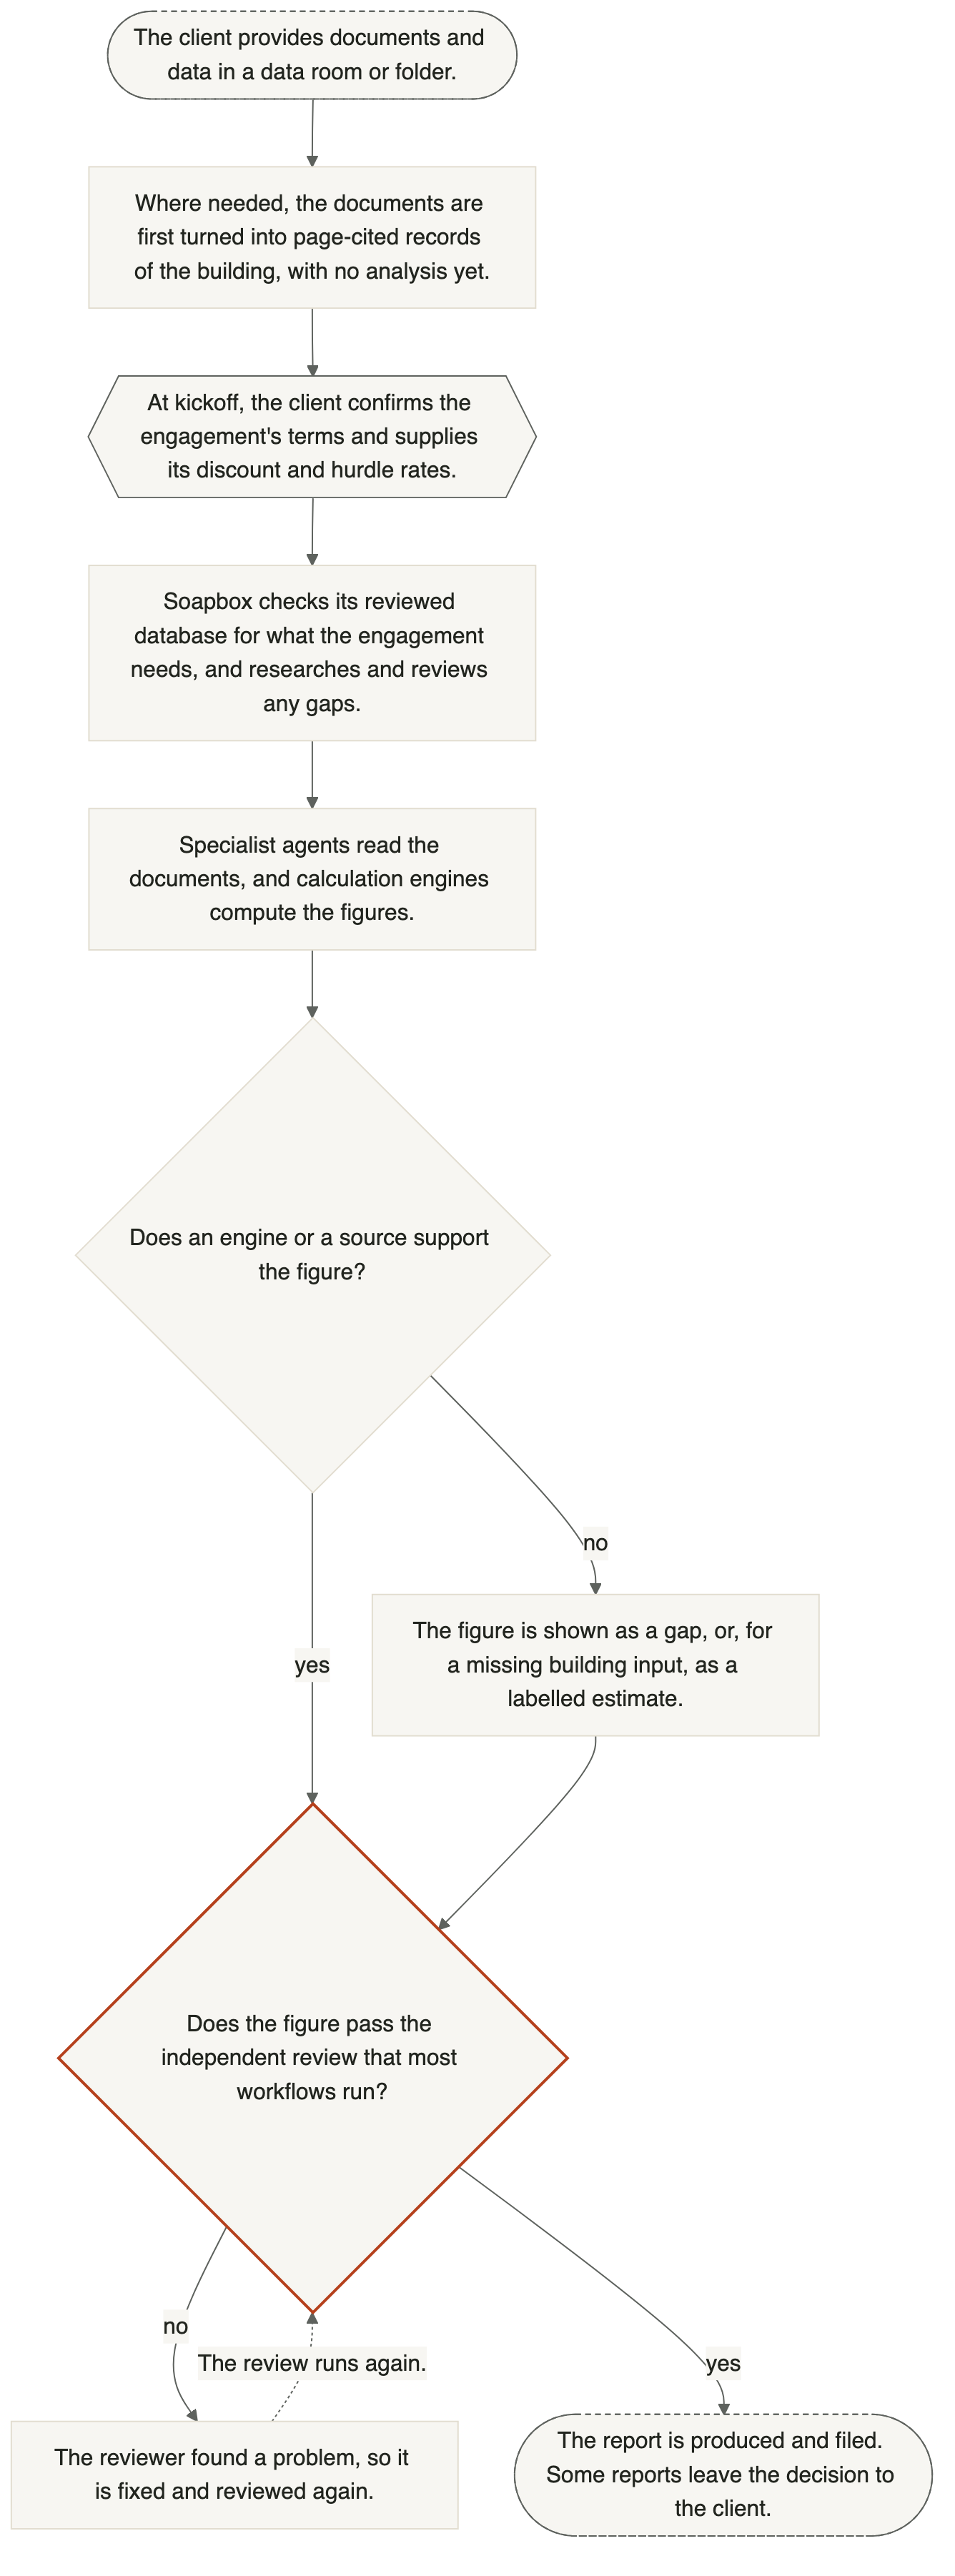
Software agents, which are AI programs given fixed instructions and tools, read every document, and separate calculation engines compute the figures. When a building input such as a wall's insulation is missing, it is estimated from a cited source and labelled as an estimate. Any other figure that no calculation or source supports is shown as a gap and is never filled in. Financial inputs such as discount and hurdle rates come from the client at the start of the engagement.
Soapbox does not invent a figure that nothing supports, and its costs are planning estimates rather than contractor bids (Q23).
Figure 1 From the documents to a filed report, calculation engines compute the figures, and a figure that nothing supports is shown as a gap. Open full size
Soapbox is for people who make capital decisions about buildings. They include acquisition and deal teams, asset and portfolio managers, owners, and the teams behind a renovation or an HVAC replacement program.
For acquisitions there are screens. A Deal Screen reviews one offering memorandum, a sustainability risk screen comes before the investment team forms a view of value, and due diligence covers a target portfolio inside a bid window.
For buildings already owned, a decarbonization plan serves an investor-owned building that will be sold, and an institutional plan serves a school, civic building or hospital that its owner keeps. At portfolio level there are screens, a shortlist of the data to request, a board-level comparison of capital scenarios and a quarterly ESG profile for a sponsor or fund.
A renovation analysis is written for the construction manager, and the results of an equipment replacement program are written into the client's own slide deck.
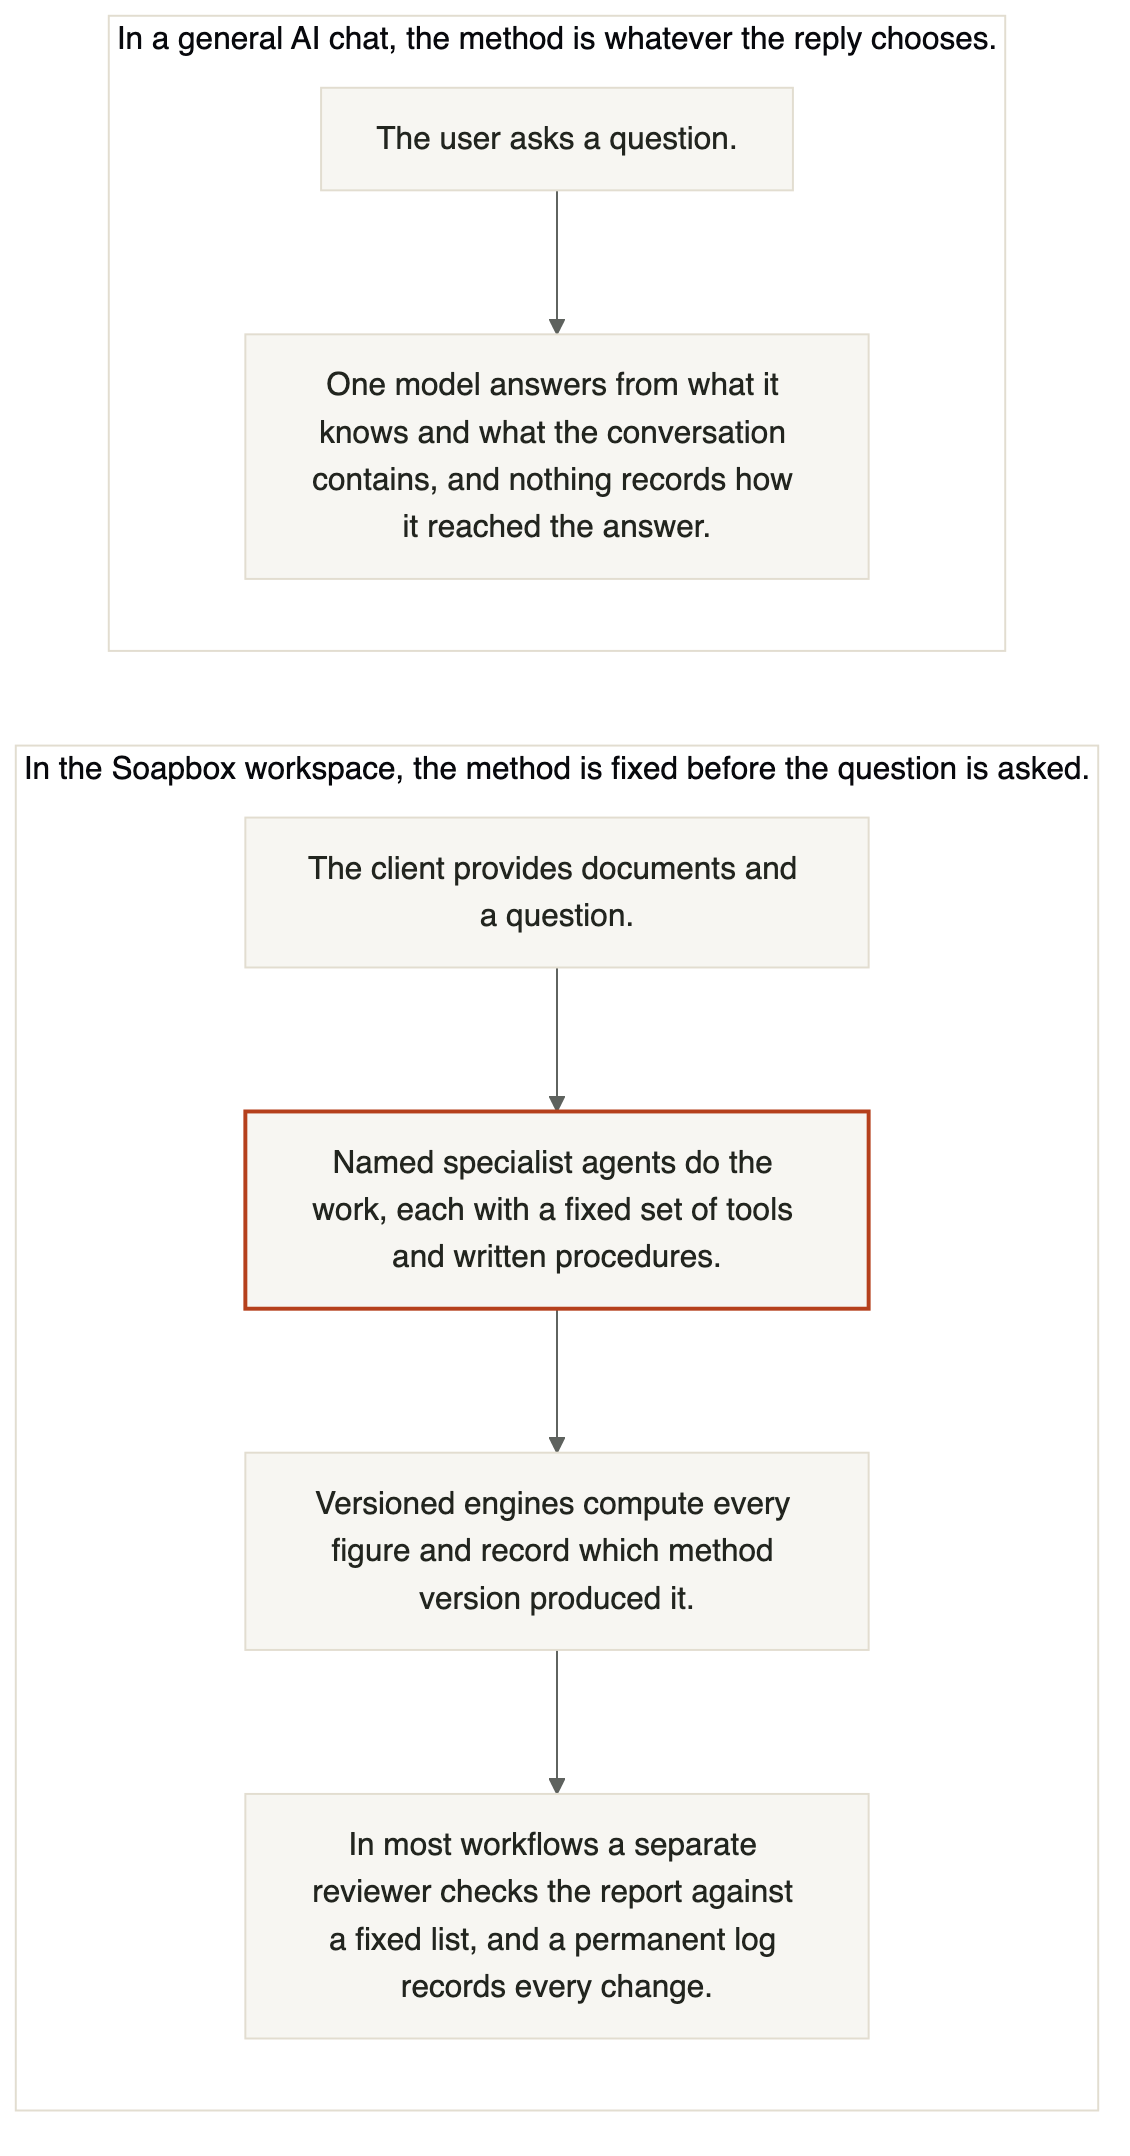
Soapbox is a managed workspace, which means the method is fixed before any question is asked. Each agent has a fixed set of tools and written procedures, and versioned calculation engines do the arithmetic.
A general AI chat answers from the model and the conversation. Its method is whatever that reply chooses, and nothing records how the answer was reached.
In Soapbox each agent is defined in advance by an expert, outside any conversation. The definition sets the model, its instructions, the calculation tools it may call and the written procedures it must follow. A coordinating agent assigns work to named specialist agents, and the figures come from calculation engines, not from the language model.
Each workflow saves the engagement's state to a stored record at every phase. Each review is logged in a record that cannot be edited afterwards. In most workflows, before the report is produced, a separate review agent, which has no access to the original conversation, checks the report against a fixed list.
Figure 2 In a general AI chat the method is whatever the reply chooses, while in the Soapbox workspace the method is fixed before the question is asked. Open full size
Part B
How the system works
This part explains how the agents, the calculation engines and the people who confirm each step share the work behind a figure.
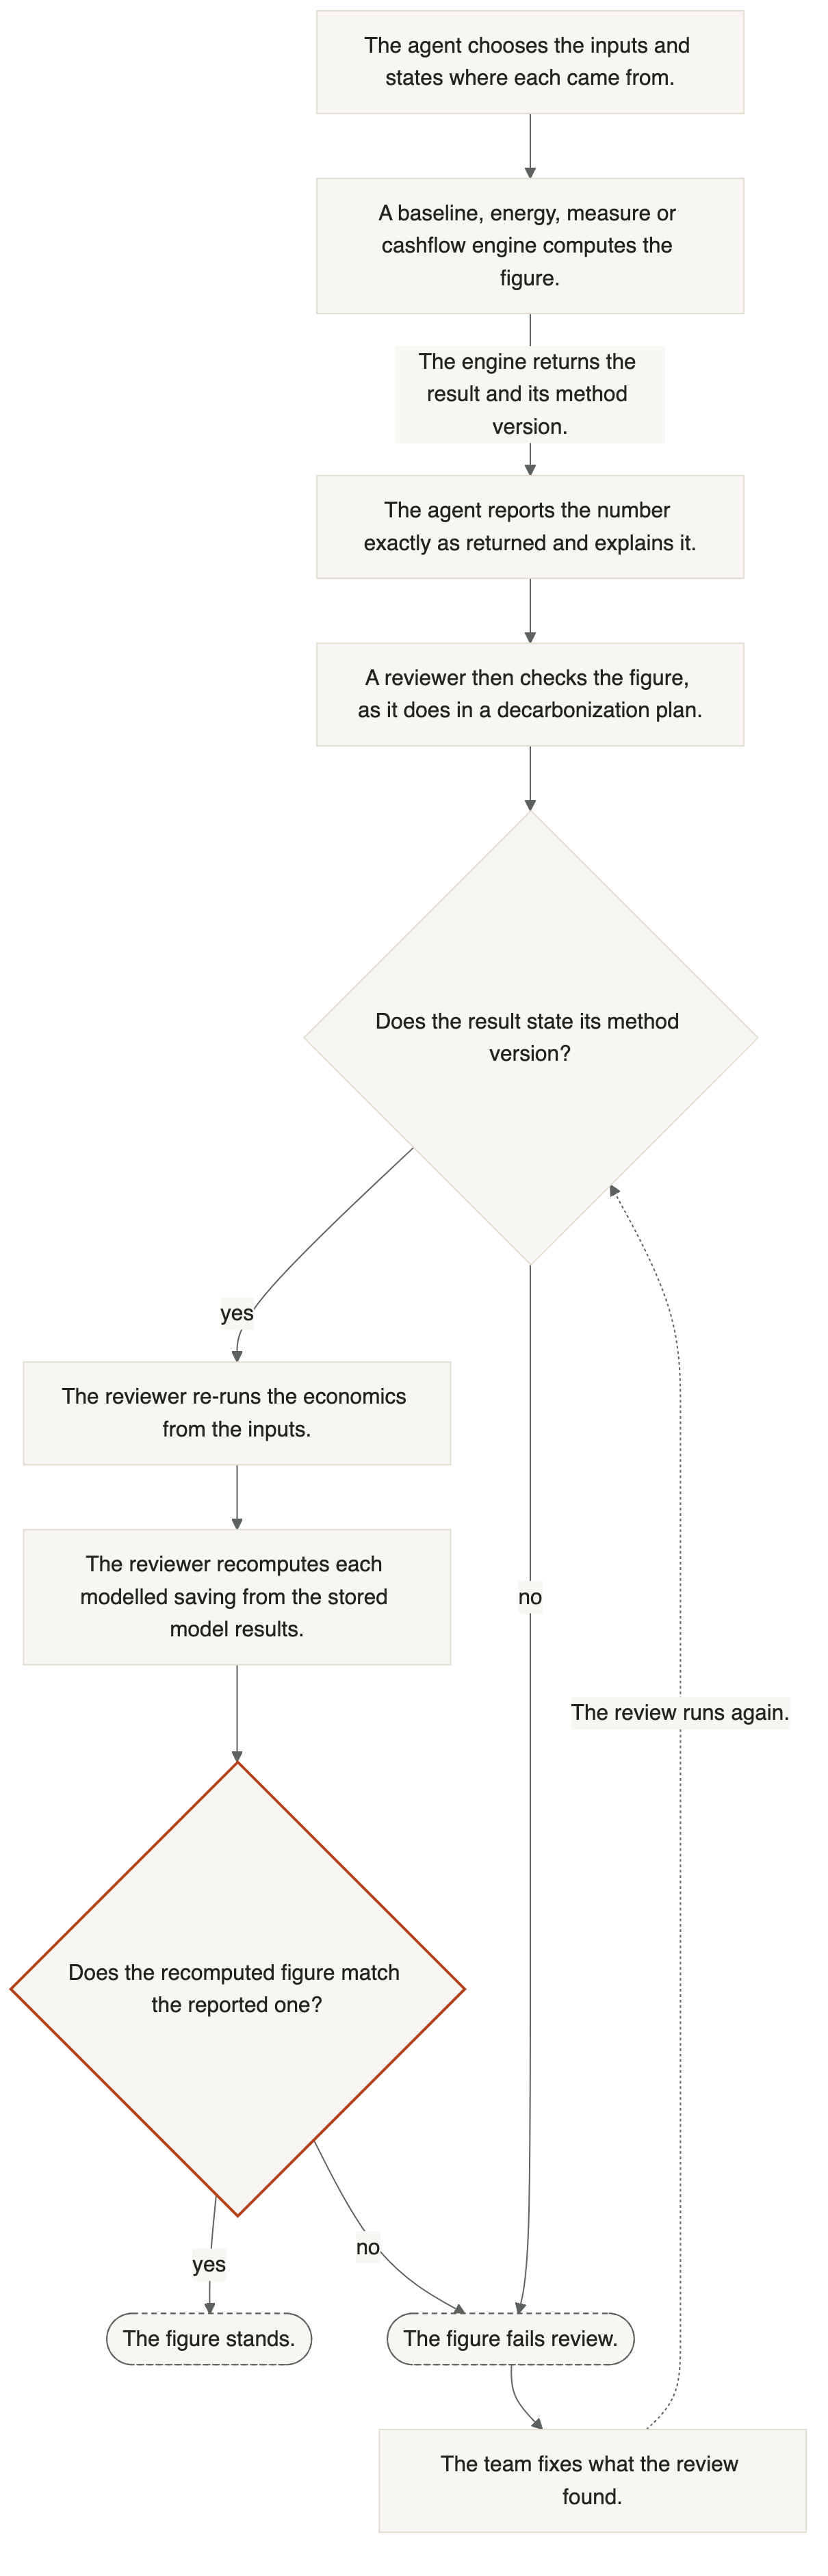
Deterministic, versioned calculation engines do the math. The language model chooses the inputs, calls the engine and explains the result, and in most workflows a separate reviewer then recomputes the figures independently.
The engines are separate programs. A baseline engine fits regressions of energy use against outdoor temperature and reports whether the fit meets ASHRAE Guideline 14. An energy engine runs EnergyPlus building simulations. A measure engine applies a stated formula for each type of saving, and a cashflow engine computes payback, IRR and NPV. Each engine reports the method version behind its result.
The agents are told not to do the sums. Every workflow requires that each reported figure comes from a calculation engine, a written procedure or a cited source.
Because an instruction can be ignored, the reviewer re-derives each figure it checks from that figure's inputs.
Figure 3 The model chooses the inputs and explains the result, the engines compute the figure, and a reviewer recomputes it. Open full size
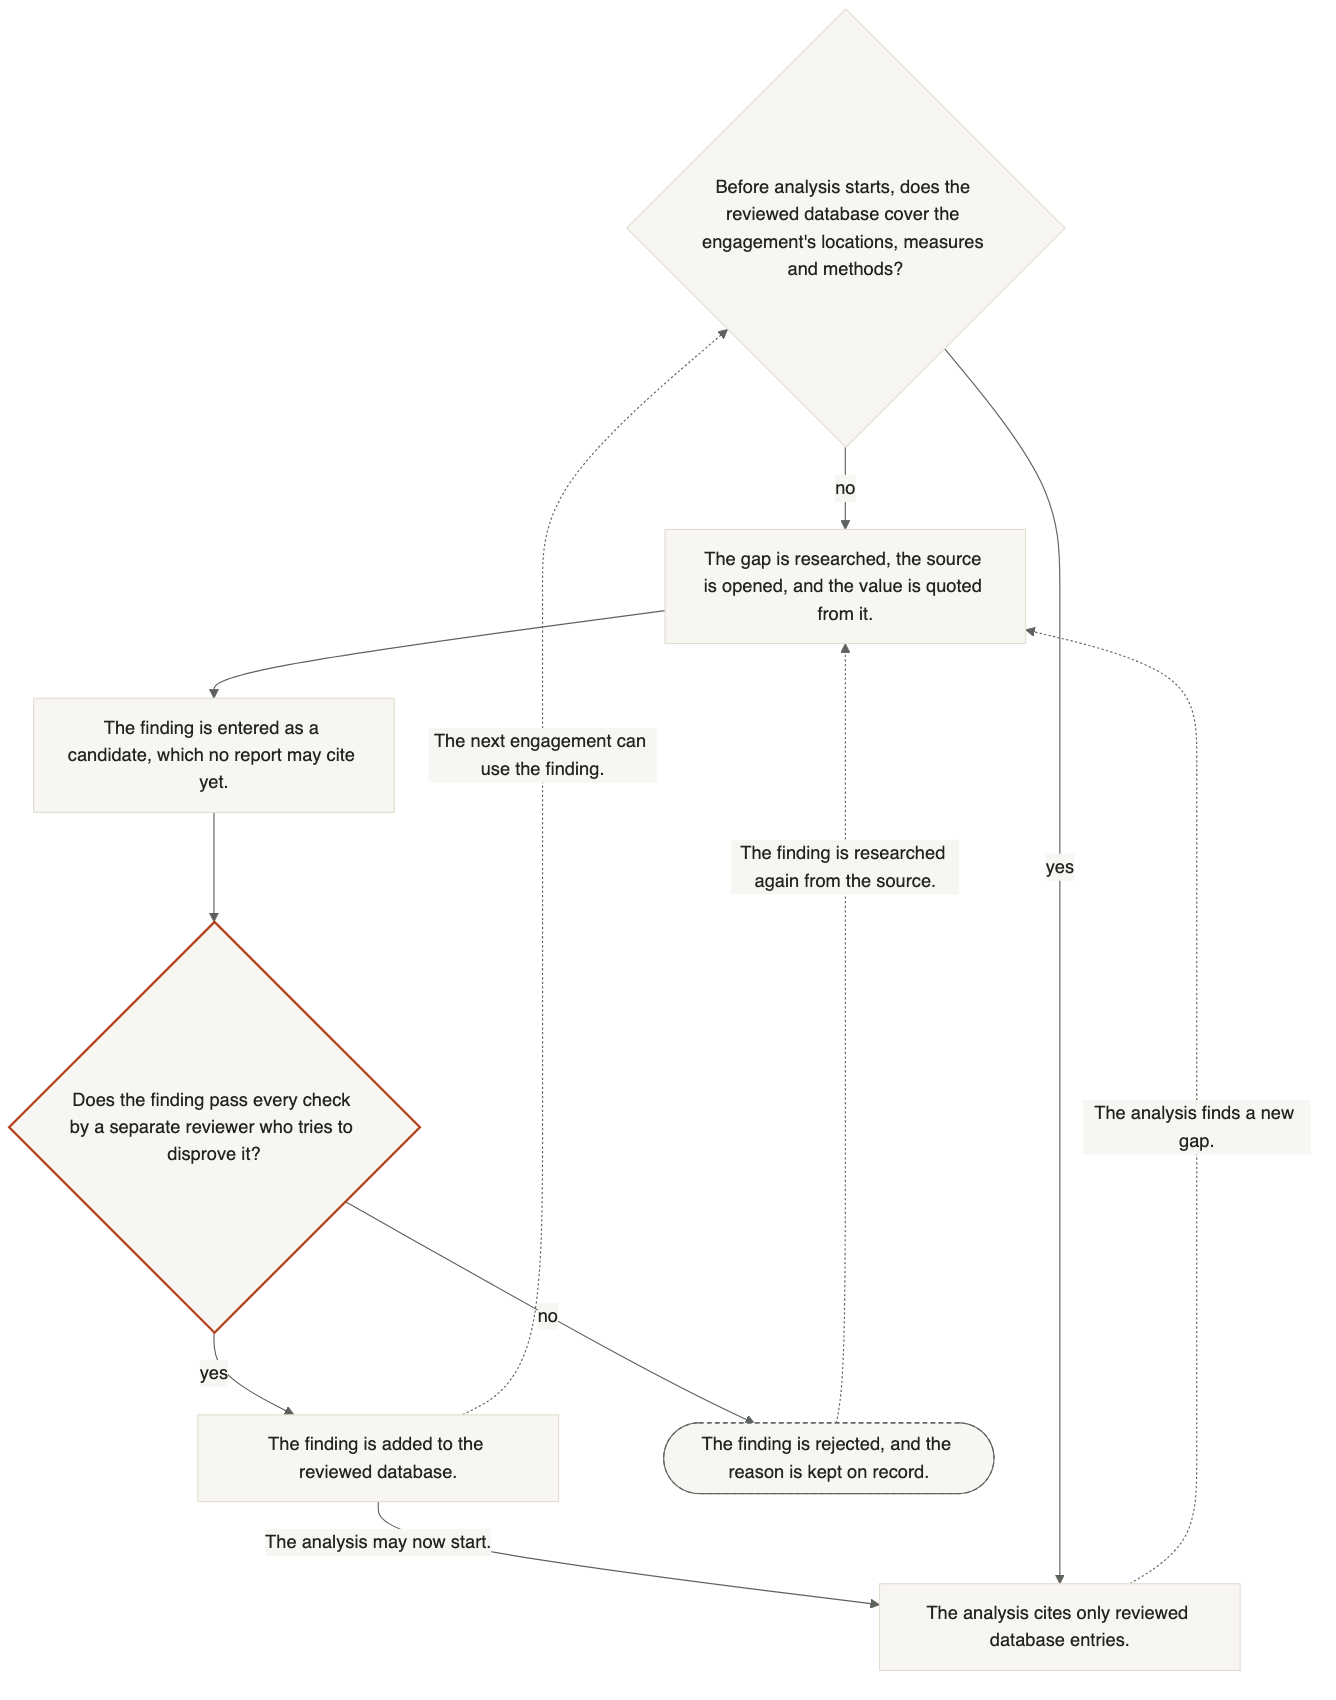
The AI draws its knowledge from shared databases kept outside the model. They hold reviewed facts such as equipment costs, utility rates, incentive programs, measure performance and regulations, and this page calls them the reviewed database. An engagement checks the reviewed database for what it needs, researches every gap from an original published source, and has each finding reviewed before anything cites it.
This check runs before any analysis starts. It looks for the engagement's locations, likely measures and methods, and researches each gap it finds. A search that finds nothing is recorded with its search terms, so that it is not repeated.
A separate database reviewer, which did not do the research, then checks the source, checks that the value is plausible, and checks that nothing in the finding identifies a client. It approves the finding only if every check passes, and the engagement cannot move on until that review is done.
Figure 4 A gap that one engagement finds is researched and reviewed, and the next engagement can then use the approved finding. Open full size
A person confirms the work at set points. Every workflow asks a person to confirm its terms before the work starts, and it waits for the answer. Which confirmations follow depends on the workflow.
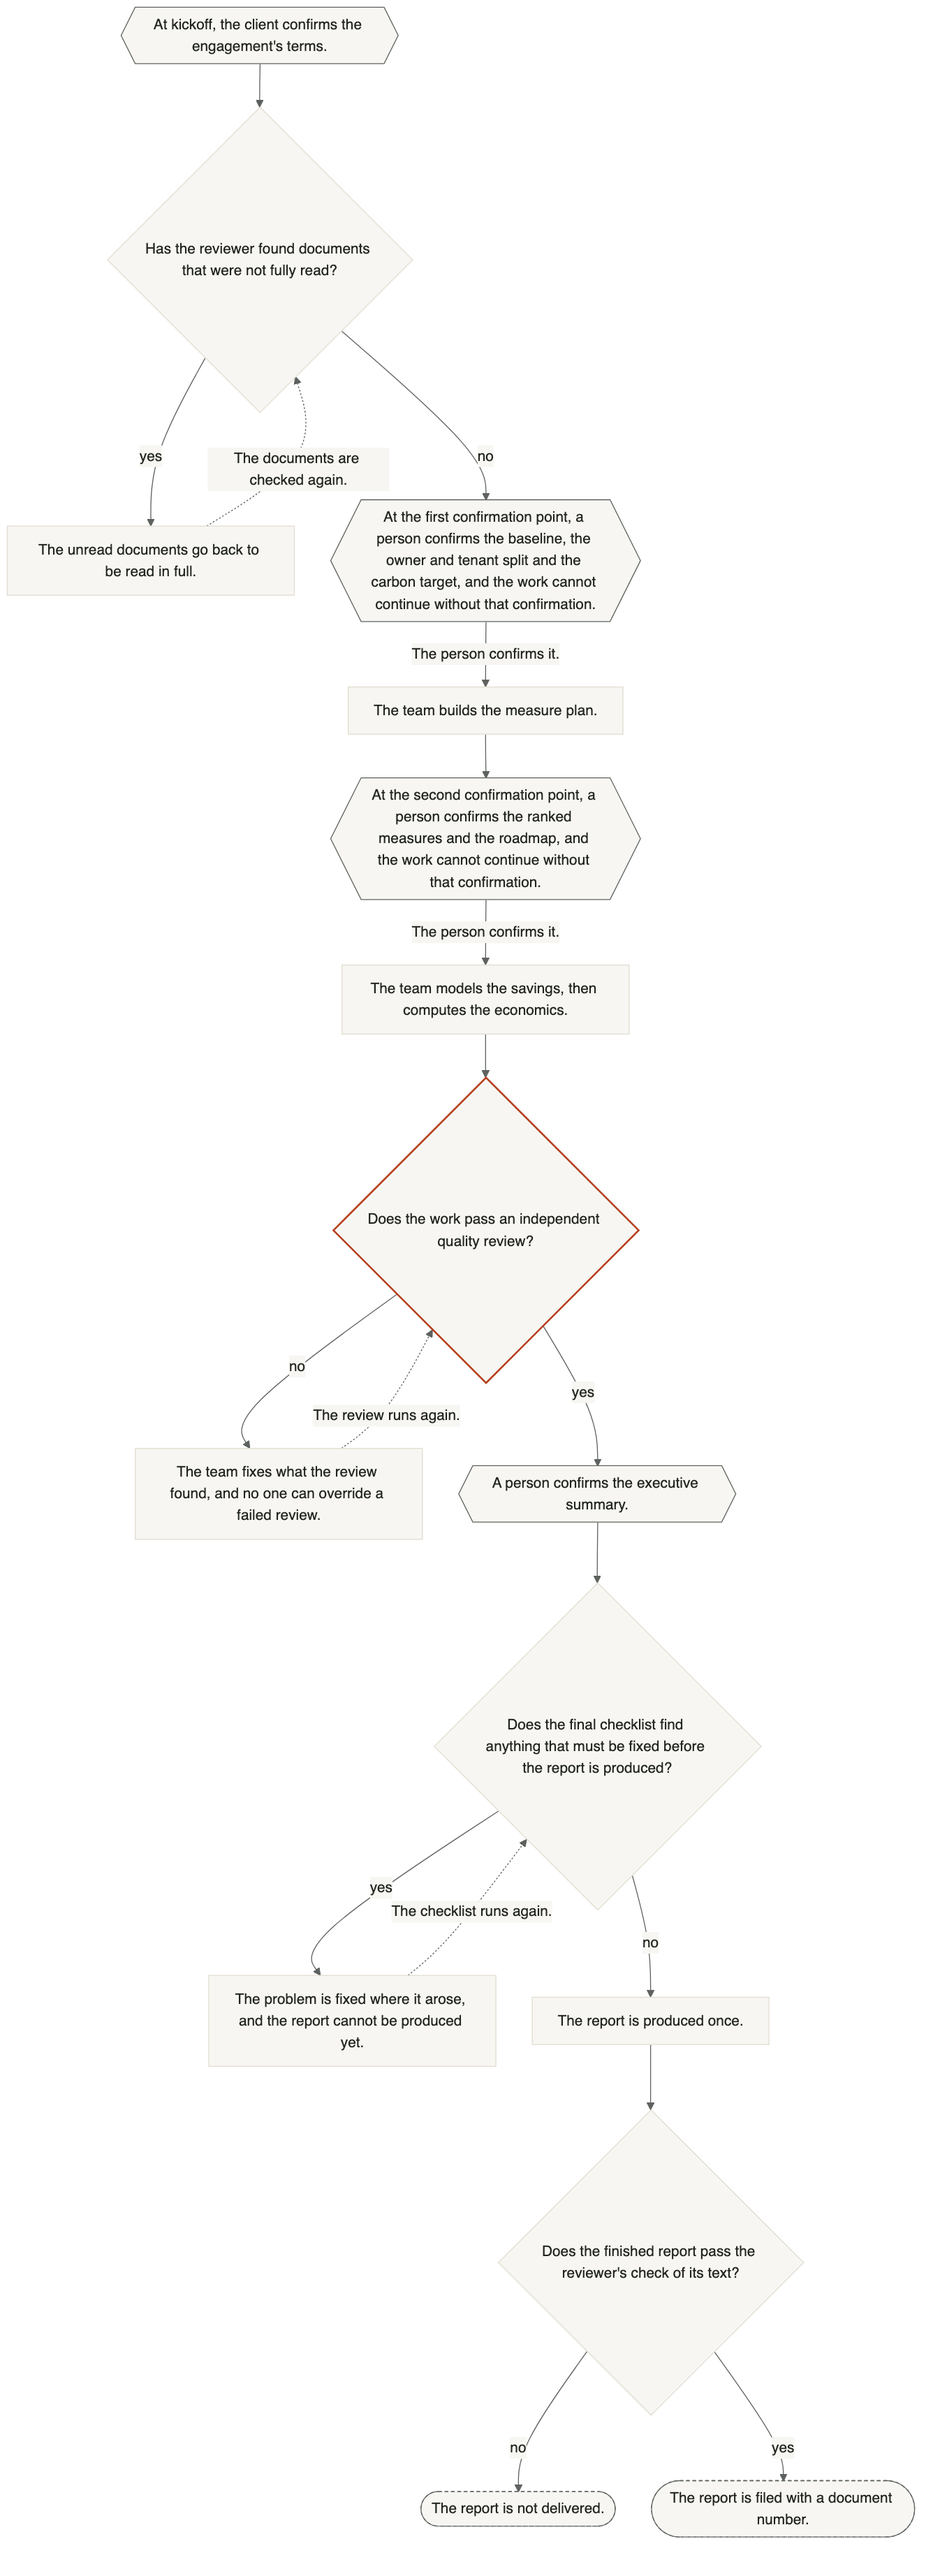
In a decarbonization plan, for example, which Figure 5 shows, a person first confirms the baseline, the split of costs and savings between owner and tenants, and the carbon target. A person then confirms the ranked measures and the year-by-year roadmap. Finally, a person confirms the executive summary before the report is produced.
Each confirmation is recorded with the engagement.
Figure 5 In a decarbonization plan, the work waits for a person to confirm it at set points, and a failed review sends it back. Open full size
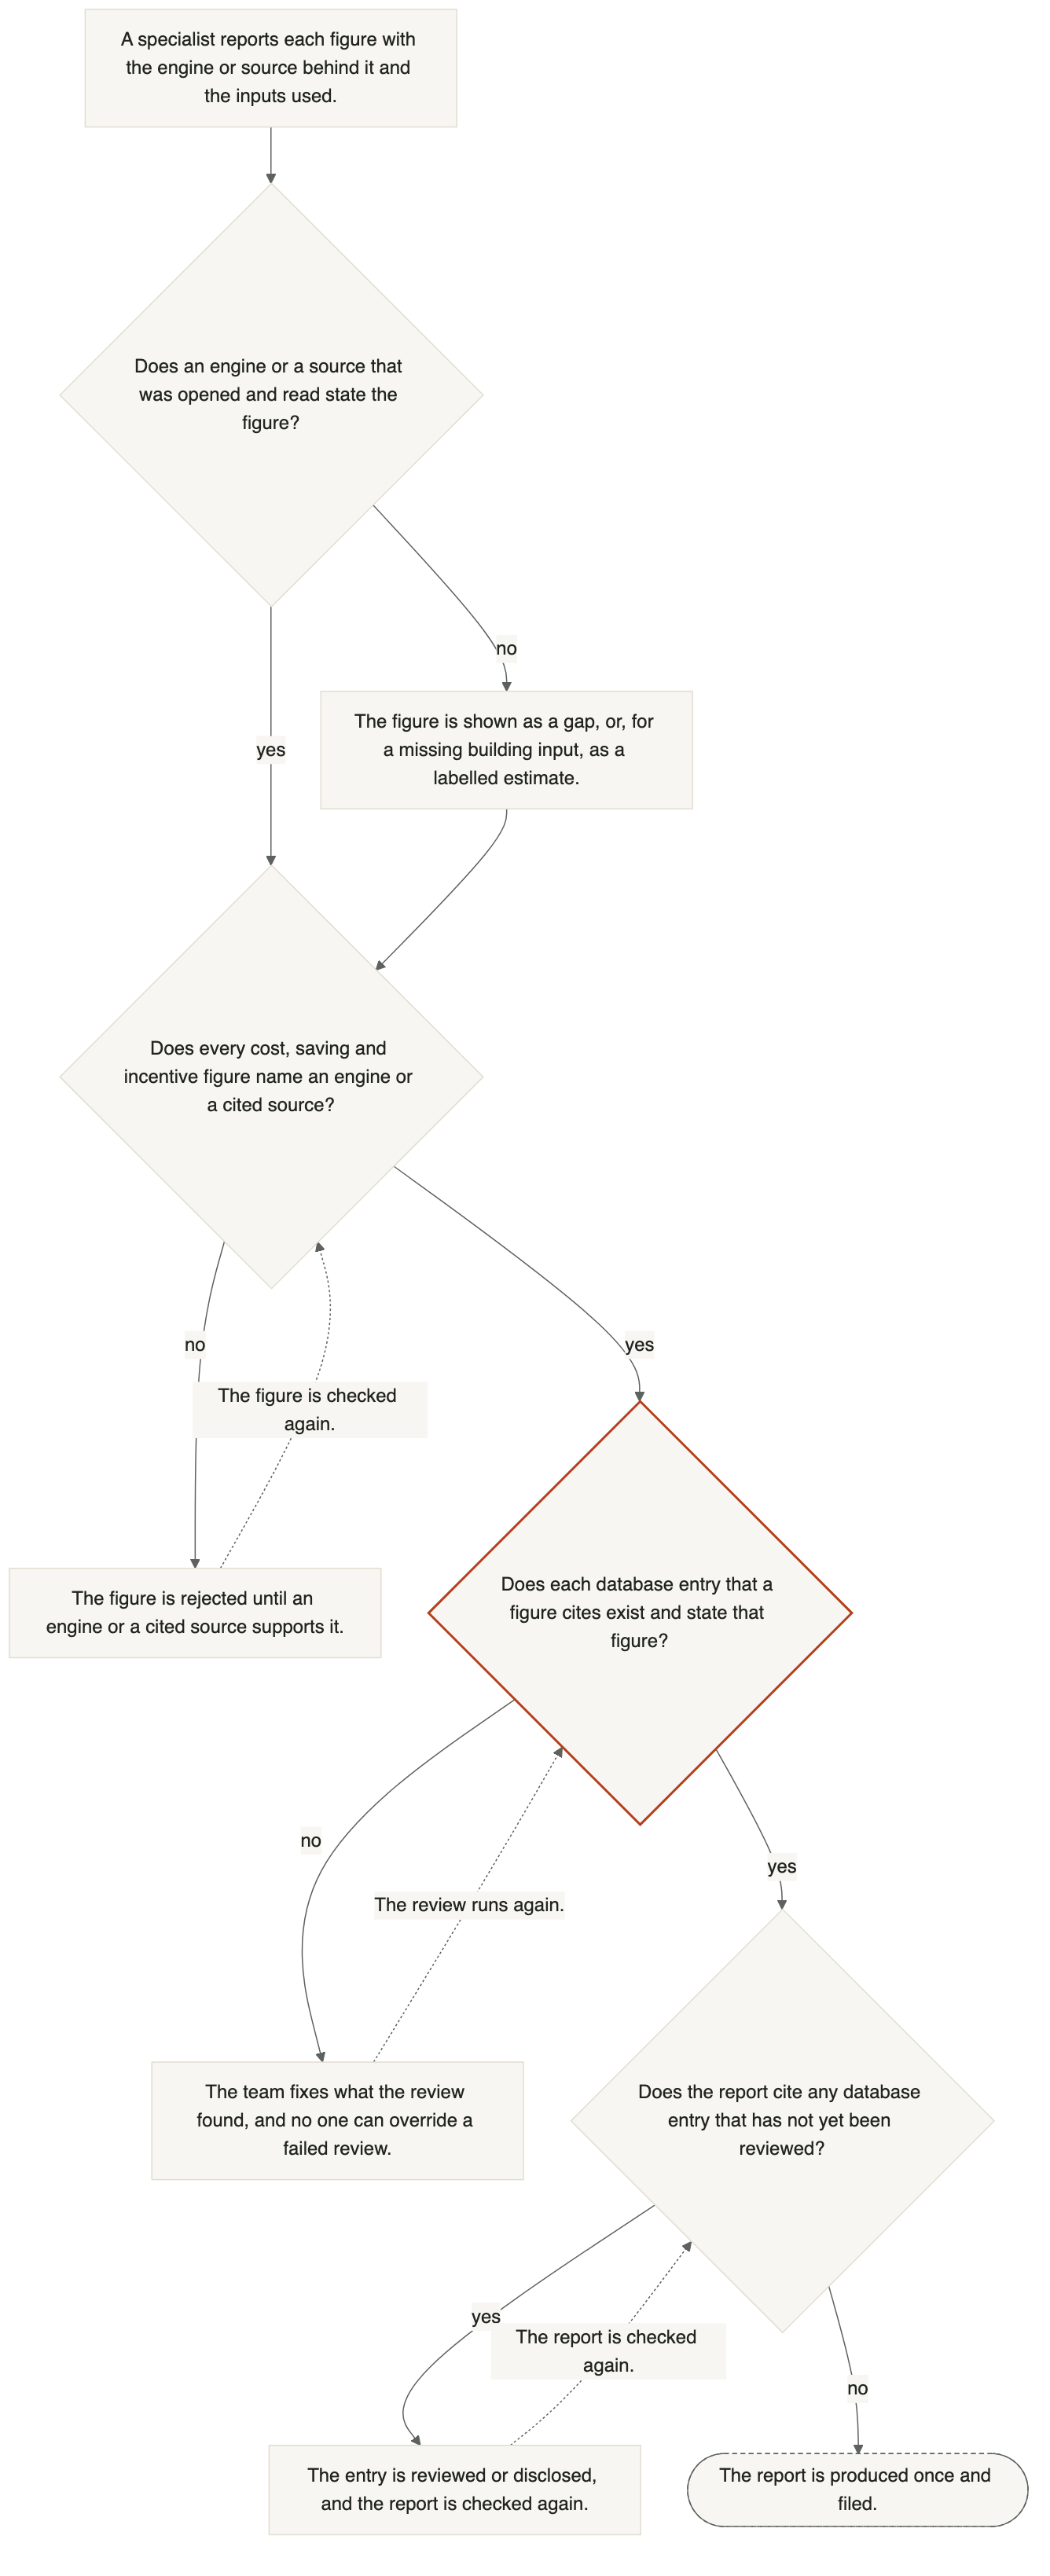
Rules and automated checks prevent fabrication. Every figure must name the engine or source behind it, and a gap is shown as a gap rather than filled in. No report is produced while it cites a database entry that has not yet passed review.
Every specialist agent works under one rule. It must never invent a figure, it must name the tool and the inputs behind each figure, and it must say plainly when a tool cannot supply one. An estimate without a label counts as a fabrication, and an earlier Soapbox report is never used as evidence.
Research quotes the document it opened and gives the page or section. A source that cannot be retrieved is treated as a gap, not as a citation. An automated check rejects any cost, saving or incentive figure that has neither a calculation engine nor a cited source behind it.
In the workflows that have a reviewer, the review looks up every database entry that a cost, performance or incentive figure cites. It fails a figure that the entry does not support, and it fails an entry that is for a different item.
Figure 6 In a decarbonization plan, every figure needs an engine or a source that was opened and read, and a failed review sends the work back. Open full size
A review agent that did none of the work checks it, and it sees only the report's data or the finished report together with its list of checks. It recomputes figures from their inputs. If the review fails, the report stops. The exception is work that covers many assets, where a failure is disclosed against the asset concerned instead.
The review runs twice: once on the assembled report data before the report is produced, and once on the finished report before it is delivered. Each pass receives only what it reviews and its checks, never the conversation behind them. The reviewer records its own verdict with the engagement, and a failure is fixed and reviewed again at the same point.
The reviewer's rule is to recompute rather than to read. In a decarbonization plan, for example, it re-runs the cashflow, fetches the CRREM pathway again and re-derives the year the building would strand. CRREM publishes the carbon intensity a building must stay under each year to 2050, and a building strands in the first year it goes over that limit. It also rebuilds the energy model and confirms that it is identical to the one used, recomputes each modelled saving from the stored results, and looks up every cited database entry to check the value used.
Where a finding is about a report template's rules, it must cite the template currently in use. If the reviewer's checklist disagrees with the template, the template wins and the disagreement is reported.[4]
Tests run before any change to a tool is released, and version numbers stop a changed method from shipping under an old version. In most workflows a reviewer also recomputes the figures on every engagement.
Each change runs the tests of the programs it touches. The EnergyPlus engine's heat-balance tests, for example, run real simulations on the engine that the change would release, and a skipped test fails the run. The database programs are tested against a real database.
A change to how an engine calculates must carry a new, higher version number, so an old result always shows which method produced it. The same applies to report templates and their rules.
Tests show that the code does what it was written to do. In the workflows that have a reviewer, the reviewer also re-derives each engagement's figures from their inputs (Q4).
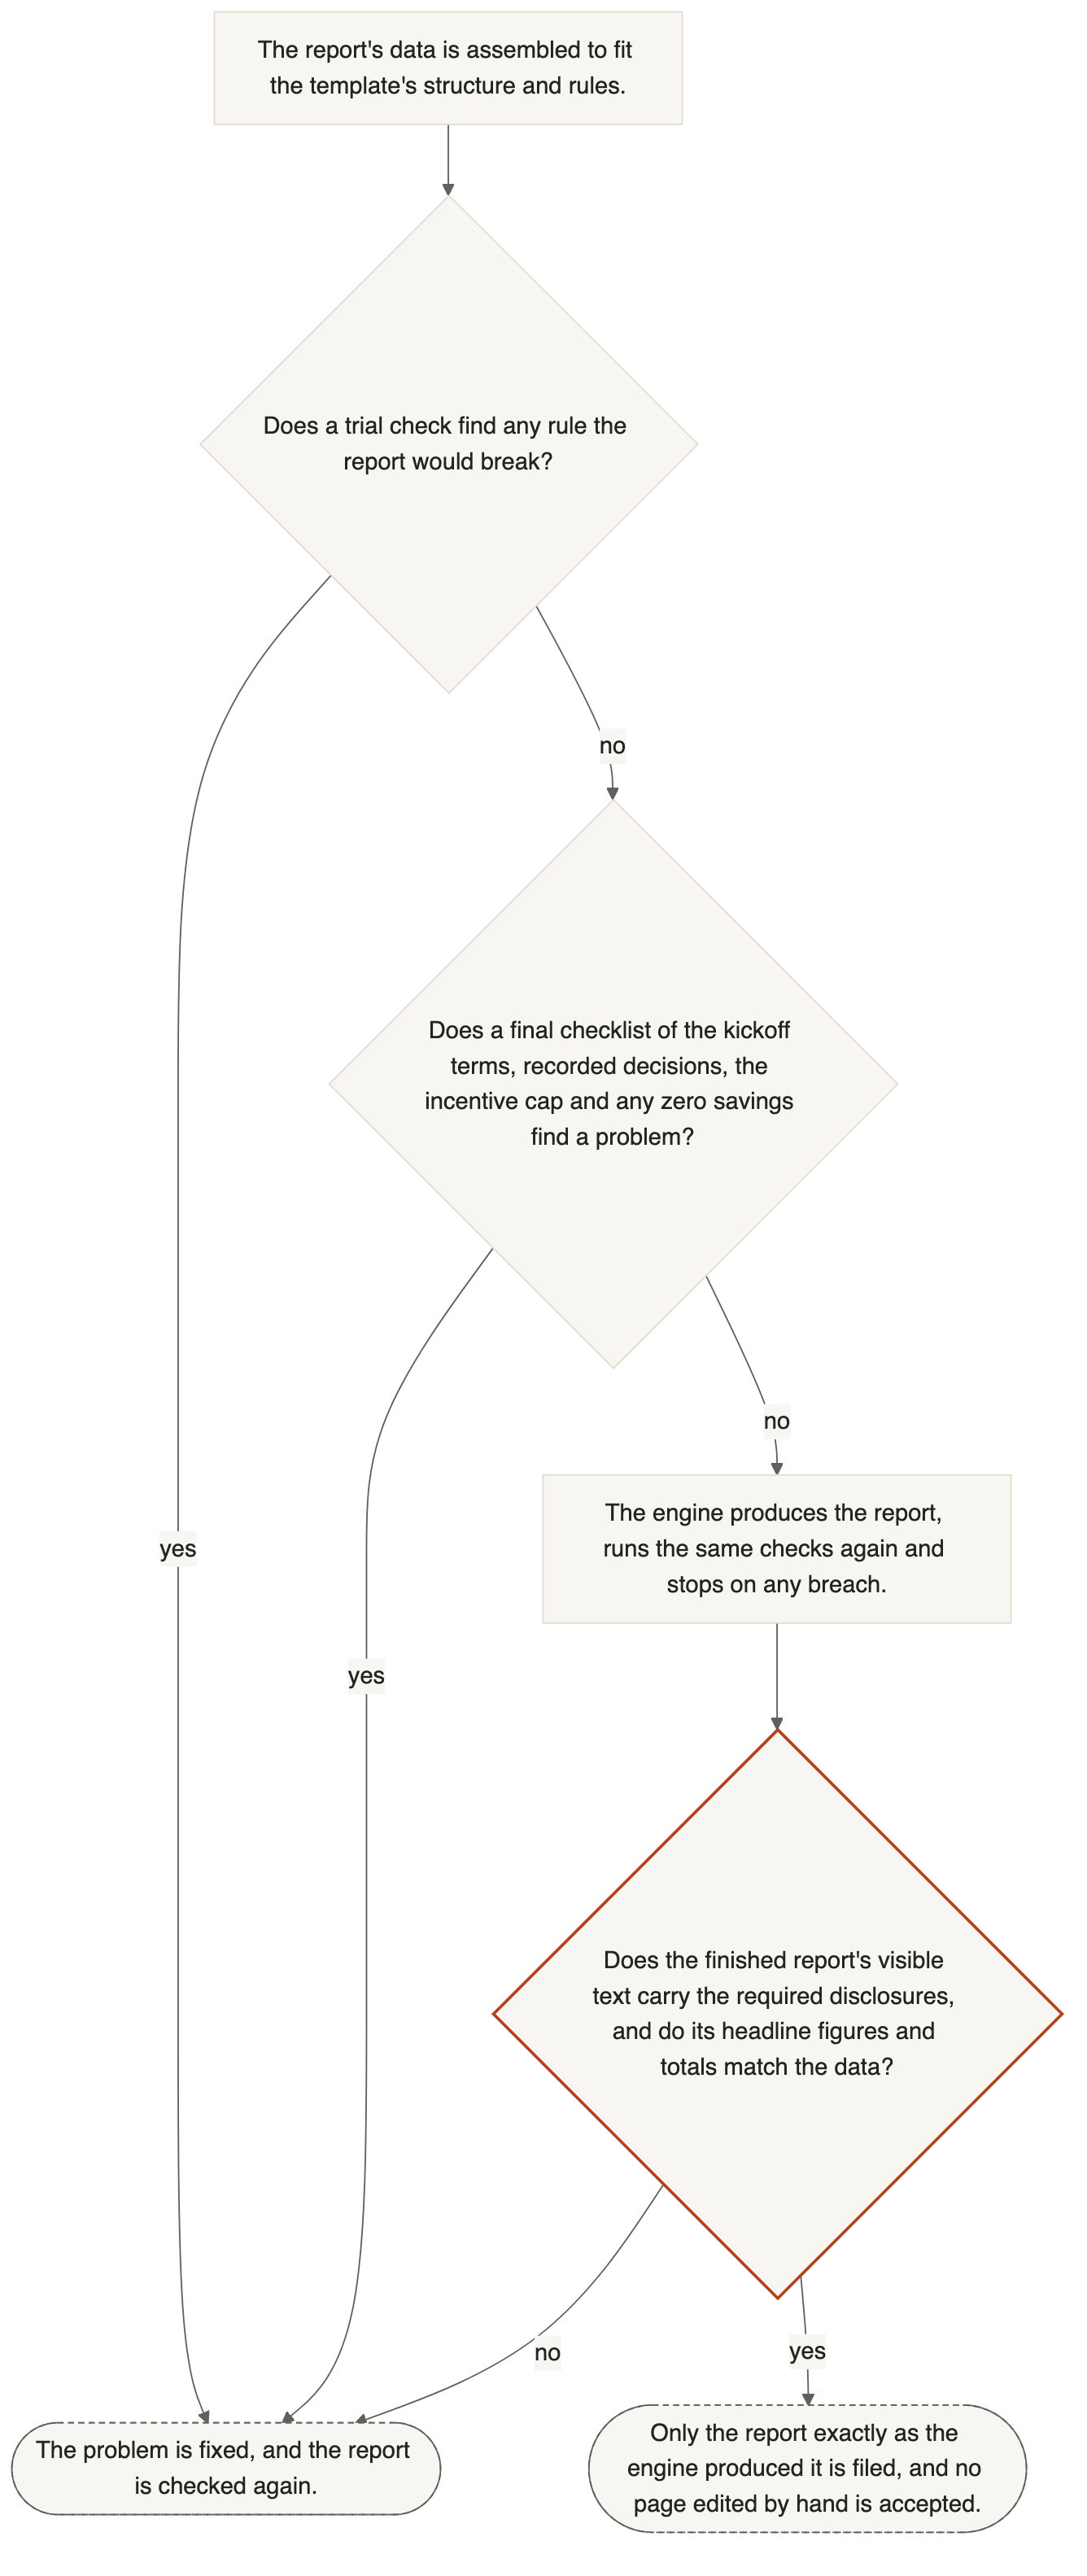
The engine that produces the report enforces the template. It will not produce a report that breaks any of the template's rules, and only the report exactly as the engine produced it can be delivered.
Each template comes with a defined structure and named rules, which are available before the report is assembled. A trial check lists every rule the report would break, the engine stops on any breach when it produces the report, and tests keep the published rules and the checks identical.
In a decarbonization plan, for example, a final check then reads the text a reader would see. It checks the required disclosures, compares the headline figures with the data and checks the table totals. If this check cannot run, the report is held. A page edited by hand is never accepted.
Figure 7 In a decarbonization plan, the report is checked against its template's rules before, during and after it is produced. Open full size
Scheduled research keeps the knowledge current, in addition to the check each engagement runs at its start. A monthly job checks the citations in the reviewed database again and researches stale entries, a daily job researches open gaps, and every finding is reviewed before use.
Each month every citation is fetched again and its value compared. A change is entered as a correction and reviewed. Entries older than a set period are researched again: regulations after 6 months; utility rates, incentives and solar payments after 12 months; costs, measure performance and price escalation after 24 months; and climate hazards after 36 months.
A corrected entry is replaced by its reviewed successor, and the old entry stays on record. A newer utility tariff filing retires the old one.
Corrections reach later work through code and shared data, not through instructions. A problem found in a report becomes an automated check in the quality review, an engine's version number can only move up, and a wrong database value is replaced after review.
The working rule is that a fix counts only if a check enforces it, not if it is merely written down as an instruction. The quality review, for example, produces its own copy of the delivered file and checks the text a reader sees, and the review fails rather than skipping that check when it cannot produce the file. Checks fuel by fuel catch a model that matches the bills overall but gets heating badly wrong.
Engine and database corrections are added as new versions rather than overwriting the old. Each engine result keeps the version number that produced it, and a wrong value is replaced by a reviewed entry while the old one stays on record.
Part C
Data in
This part explains what data an engagement starts from, and what happens when data is missing or two sources disagree.
An engagement needs the client's documents and a completed kickoff questionnaire. A missing answer either pauses the engagement or takes a stated default. A missing building input is estimated from a cited source and labelled, and it is never entered by hand.
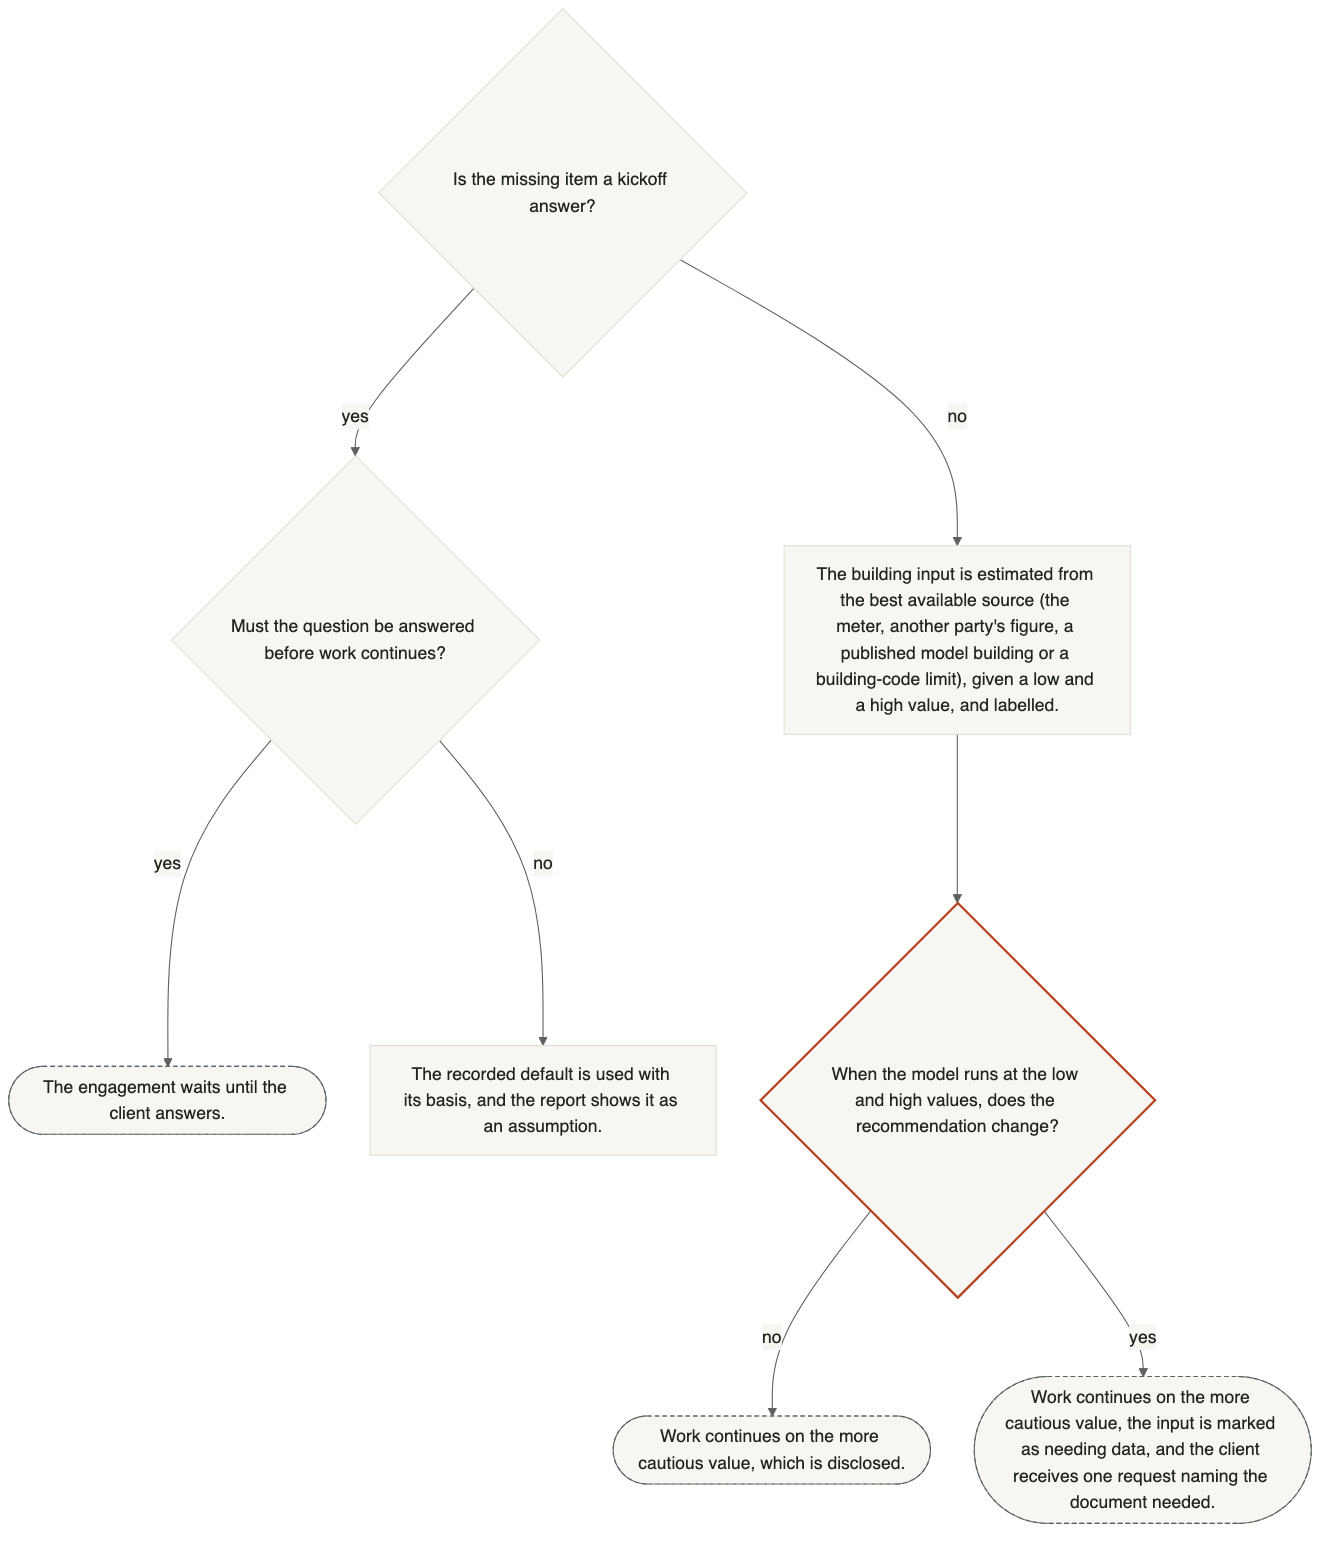
Each type of engagement has its own questions, and each question either must be answered or has a default. An unanswered required question pauses the engagement until it is answered. A question with a default takes a recorded default with its basis, which the report shows as an assumption.
A building input that no document states is estimated from the best available source, in this order: the meter, a figure another party derived, a published model building, then the limits set by building codes. This order is for building inputs such as insulation or lighting power, and equipment has its own order (Q14). The estimate is given a low and a high value and is labelled. If the low and high values would lead to different recommendations, the client receives one request naming the document that would settle it.[5][6][7]
Figure 8 A missing kickoff answer either pauses the work or takes a disclosed default, and a missing building input is estimated and then tested. Open full size
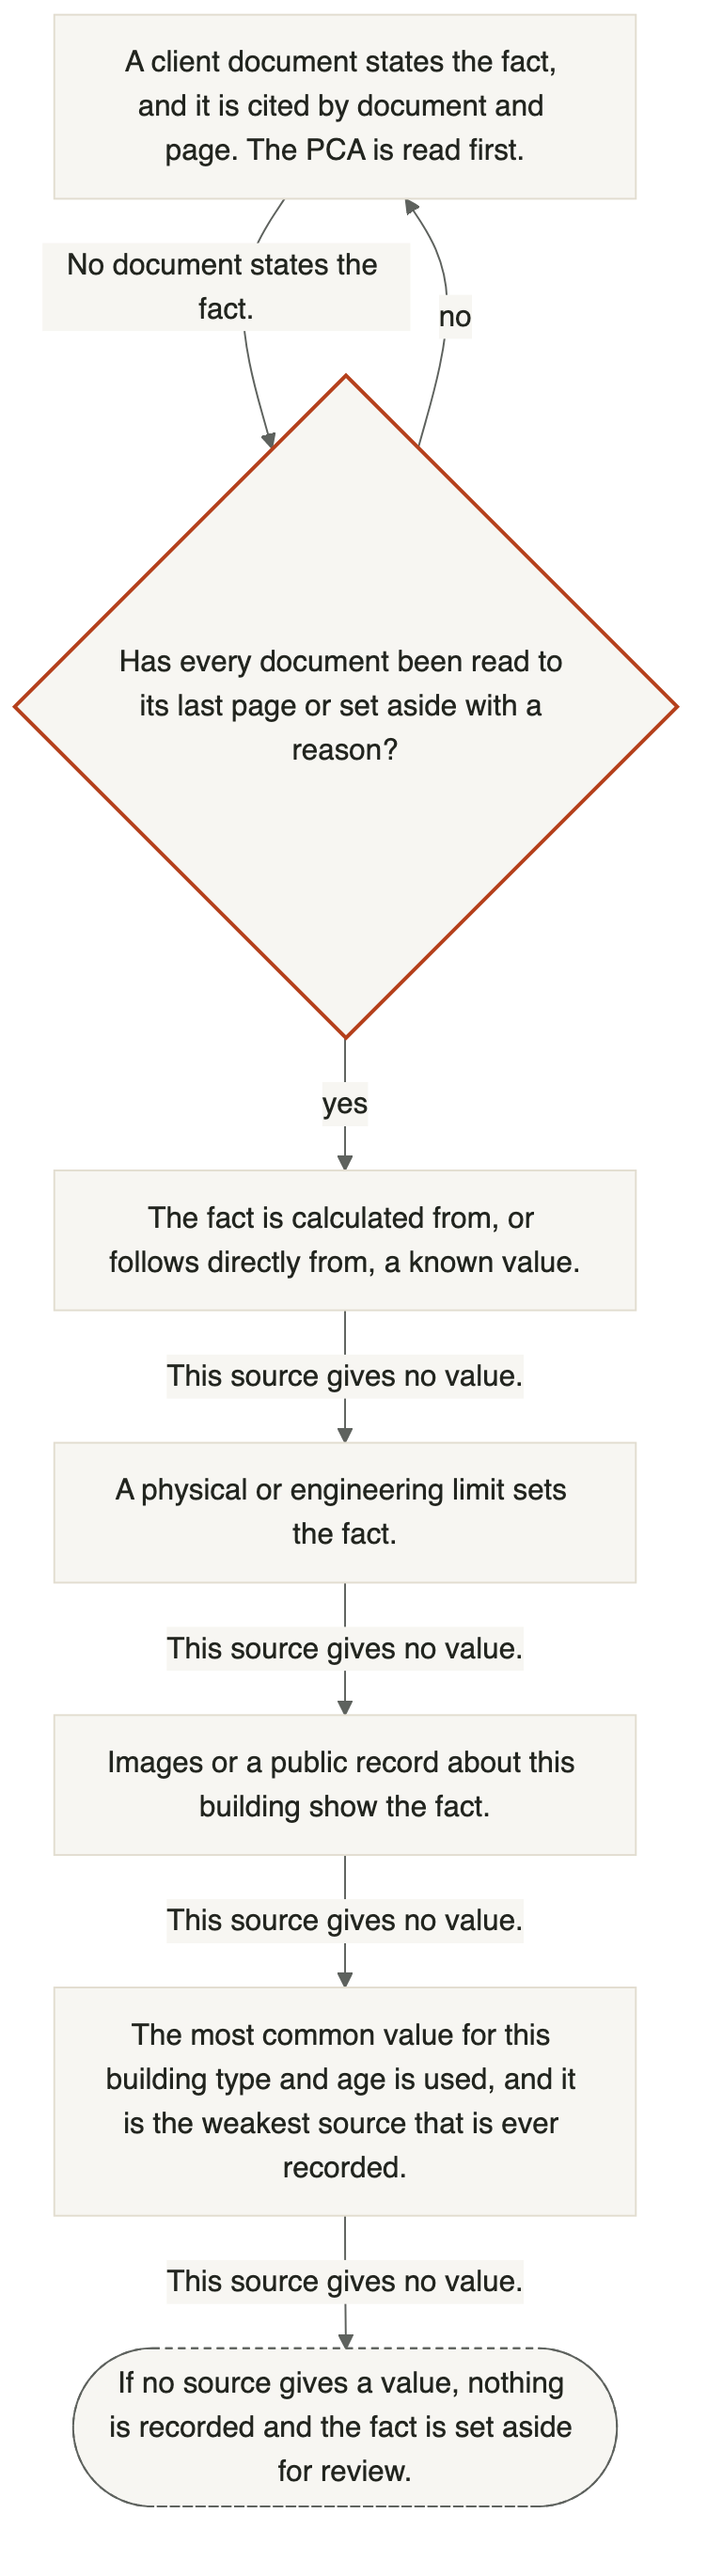
Equipment is read from the documents first, and a missing item is then estimated from other sources in a fixed order. Each value is tagged with how it was obtained, from a document that states it down to a typical value for the building type, and nothing weaker than that typical value is ever recorded.
The property condition assessment (PCA) is read first and in full, because it states the construction, envelope, equipment and utilities together in one document. A missing item is then taken from the first of these sources that gives a value: a document that states it, a value derived from a stated fact, a physical constraint, a public record about this building, the building code in force where the building is, and finally a typical value for the building type from the national ResStock or ComStock building datasets.
In portfolio creation, for example, an agent also reviews street and satellite images of the building for equipment visible from outside, and it records what it could not tell rather than guessing.[8][9][6]
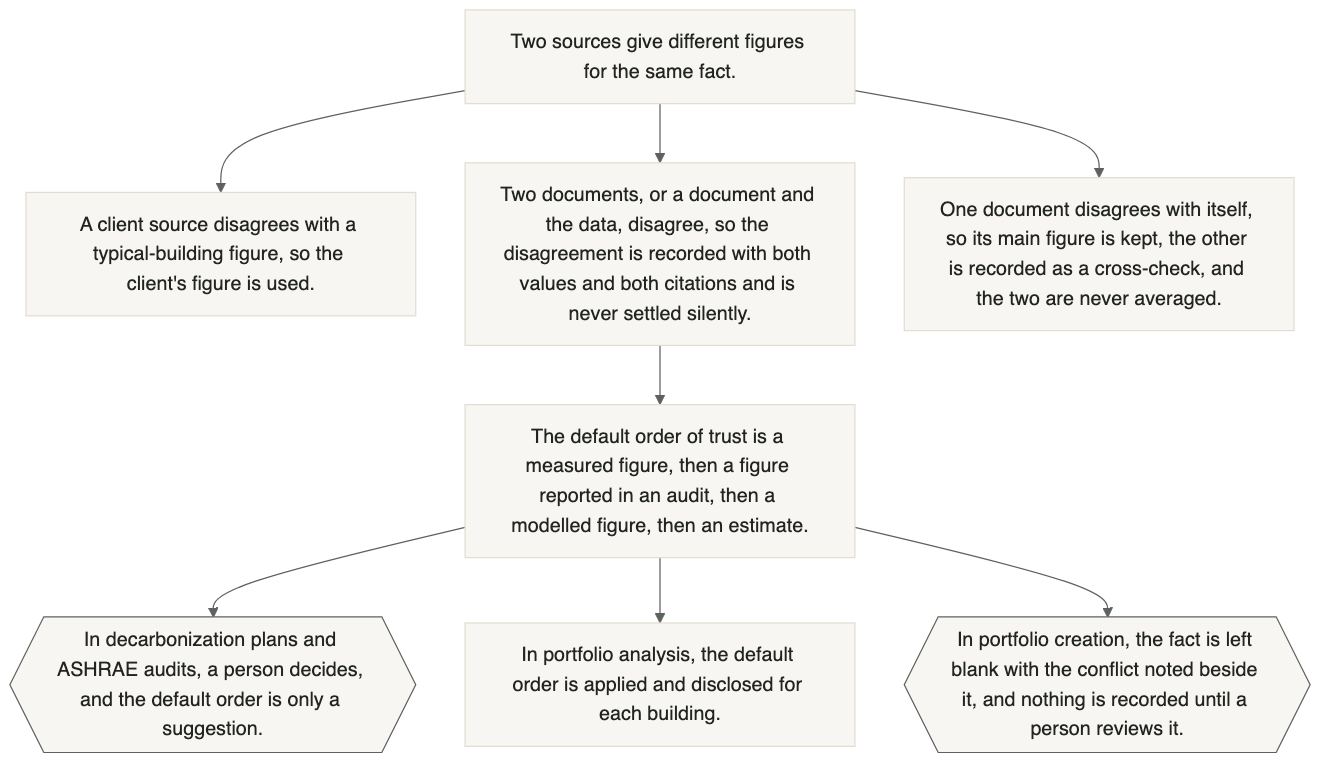
The disagreement is recorded with both figures and their citations, and it is never settled silently. Depending on the workflow, either a person decides, or a fixed order of trust applies and is disclosed in the report. The order is a measured figure first, then a figure reported in an audit, then a modelled figure, then an estimate.
In data onboarding, for example, an offering memorandum's floor area that disagrees with the PCA's is written up with both values and both citations. The client's own data is used over any typical-building figure, and two cited sources that disagree are both reported rather than one being chosen.
When one document disagrees with itself, its main figure is kept, the other is recorded as a cross-check, and the two are never averaged. A value from a site visit that conflicts with a client record is flagged, and the client's data remains the source of truth until a person decides.
Figure 9 When sources disagree, both figures are kept with their citations, and who settles the disagreement depends on the workflow. Open full size
Every baseline states which meters it covers. Bills the owner pays are never treated as the whole building, a meter that already contains smaller meters is never added to them, and a missing whole-building figure is disclosed as a gap rather than filled with the partial bills the owner pays.
Where tenants or residents pay their own utilities, the owner's bills cover only common areas and vacant units. That is the right basis for the owner's savings but the wrong one for the building's energy intensity. A whole-building figure comes from an ENERGY STAR whole-building meter, from resident billing data, or from a model labelled as modelled. If none of the three is available, no CRREM or building performance standard figure is calculated from the owner's bills.
In portfolio analysis, for example, the billing period for each fuel is chosen separately, so a missing fuel shows as a gap rather than as zero. With 6 to 11 monthly bills only a provisional fit is allowed. With no bills, there is nothing to calibrate the model to, so it is built from the building's documented characteristics and compared with similar buildings.[10][4]
They are read from the client's documents with the source cited, starting with the PCA. A value that no document states is labelled as an estimate, and a conflict between documents is reported rather than settled silently.
The reading list is every document on the building, not only those named at kickoff. Before any fact is reported as missing, every document must be logged as read in full or set aside with a reason, and a review agent repeats that count independently.
In portfolio creation, for example, floor area is not assumed to be gross floor area. On one 38-building portfolio only two buildings stated a true gross area, so the basis is recorded for each building. A person sees each building's mix of documented and typical values before anything is recorded.
Figure 10 In portfolio creation, each fact is read from the documents first and then from weaker sources in a fixed order, and nothing weaker than a typical value for the building type is recorded. Open full size
Part D
The energy model
This part explains how energy use is modelled, calibrated to the bills and adjusted for weather and occupancy.
Energy use is modelled in two ways: an EnergyPlus simulation of the building built from its documents, and a regression of its bills against outdoor temperature. The simulation is calibrated to the meter where one exists and compared with similar buildings.
The simulation is built first, from the PCA and the equipment schedules, and estimates fill only genuine gaps. A site with several buildings is modelled building by building, with amenity buildings modelled separately, and the share of the site covered is stated.
The bills are fitted with change-point regressions, which find the outdoor temperature at which heating or cooling starts. The model's split of energy by end use, such as heating, cooling and lighting, is checked against a national reference such as the Commercial Buildings Energy Consumption Survey or ComStock. An end use outside the reference range must be corrected or explained from evidence about the building before the model is used.[3][2][11][12][9][13]
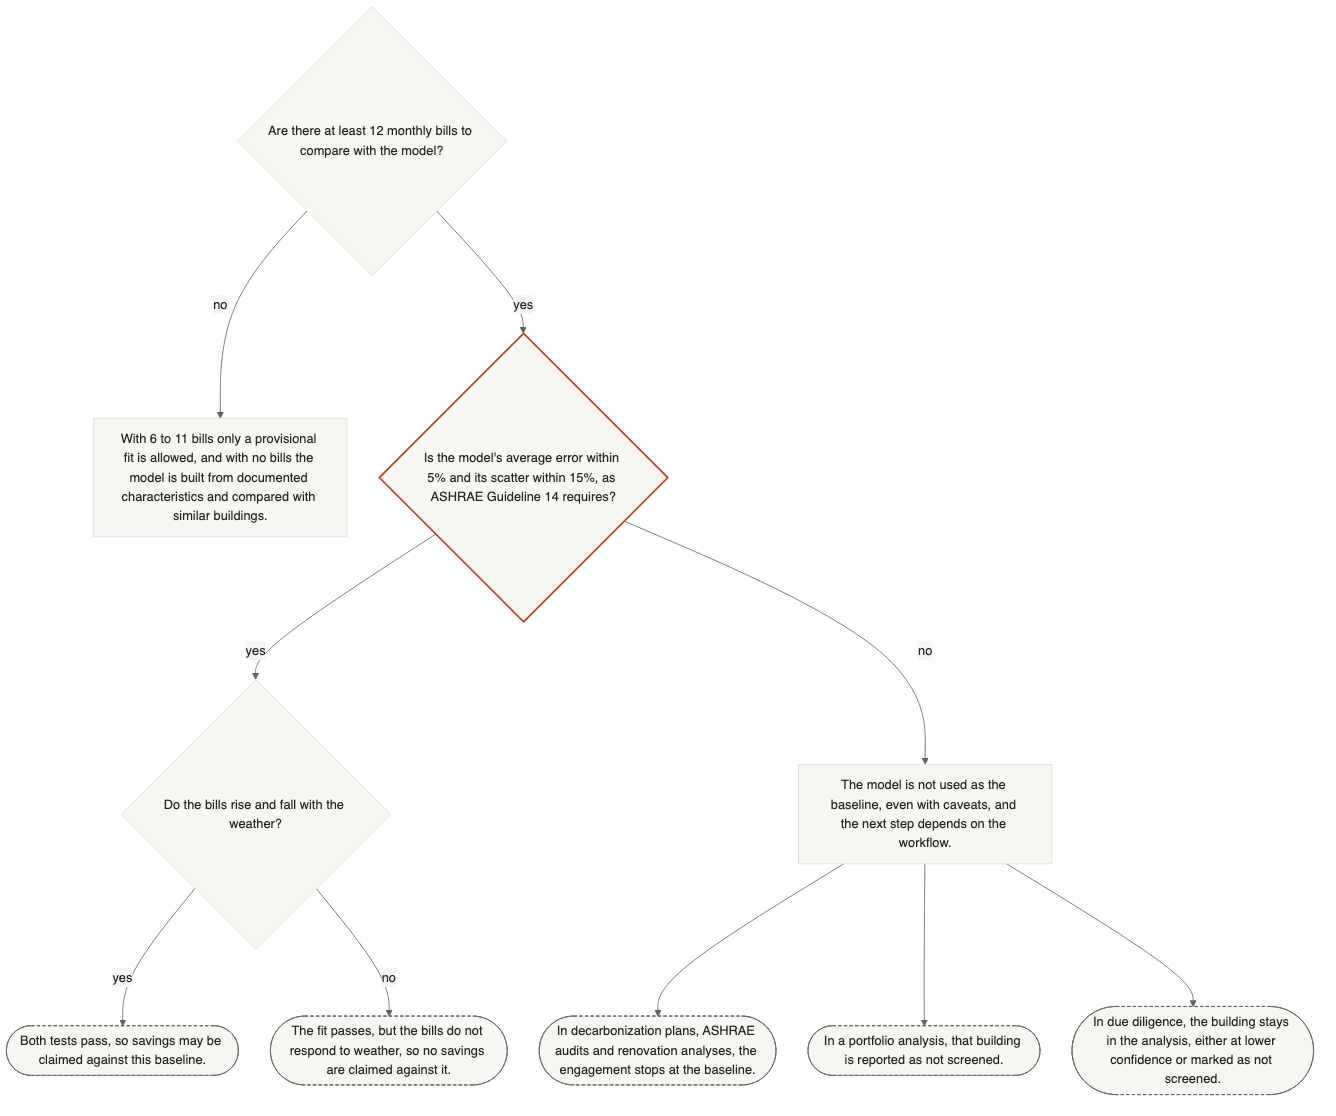
The model is calibrated to at least 12 monthly bills under ASHRAE Guideline 14, which requires the average error (NMBE) to be within 5% and the month-to-month scatter (CV(RMSE)) to be within 15%. A model that fails is not used as the baseline, and what happens next depends on the workflow.
The engines compare modelled and metered months. A fit to the bills can pass and still show no response to the weather, so the bills must also rise and fall with the weather before savings are claimed against the model.
In a decarbonization plan, for example, a failed calibration stops the engagement at the baseline. In a portfolio analysis that building is reported as not screened.[2][14]
Figure 11 A model that misses ASHRAE Guideline 14 is not used as the baseline, and what happens next depends on the workflow. Open full size
The three figures differ because each answers a different question. The bills may cover only what the owner pays, ENERGY STAR adjusts for building type, climate and size, and the baseline is restated on average weather over ten years rather than the year that was billed.
Where residents pay their own utilities, the owner's bills cover only common areas and vacant units, and the baseline states what it covers. The fitted bills are restated on the site's average weather over the last ten years, so a hot or mild billing year differs from the baseline by design.
In a decarbonization plan, for example, where the model and the meter differ, the baseline is the metered one, and the model's figure is shown only as a labelled sensitivity.[10][15]
Weather is handled by regression and a typical year. The bills are fitted against each billing period's outdoor temperature and then restated on a typical year. Occupancy enters the model as schedules, and vacant units and changes of tenant are handled separately.
Each billing period gets its average temperature from ERA5, a global weather reconstruction, at the building's location. The fit finds the building's own temperature at which heating or cooling starts, rather than assuming 65°F. The typical year is the site's average monthly weather over the last ten years, which also separates the energy the building uses all year from its heating and cooling.
The simulation runs on a typical-year weather file from the nearest weather station in the building's climate zone, and the file used is reported with the results. Vacant units are modelled separately where they make a material difference. When a tenant or a meter changes partway through the billing history, the history is split and the later period is used as the baseline.[15][3][16]
Part E
Measures and their costs
This part explains how measures are chosen, where their costs come from, how their savings avoid double counting and how a recommendation is shown.
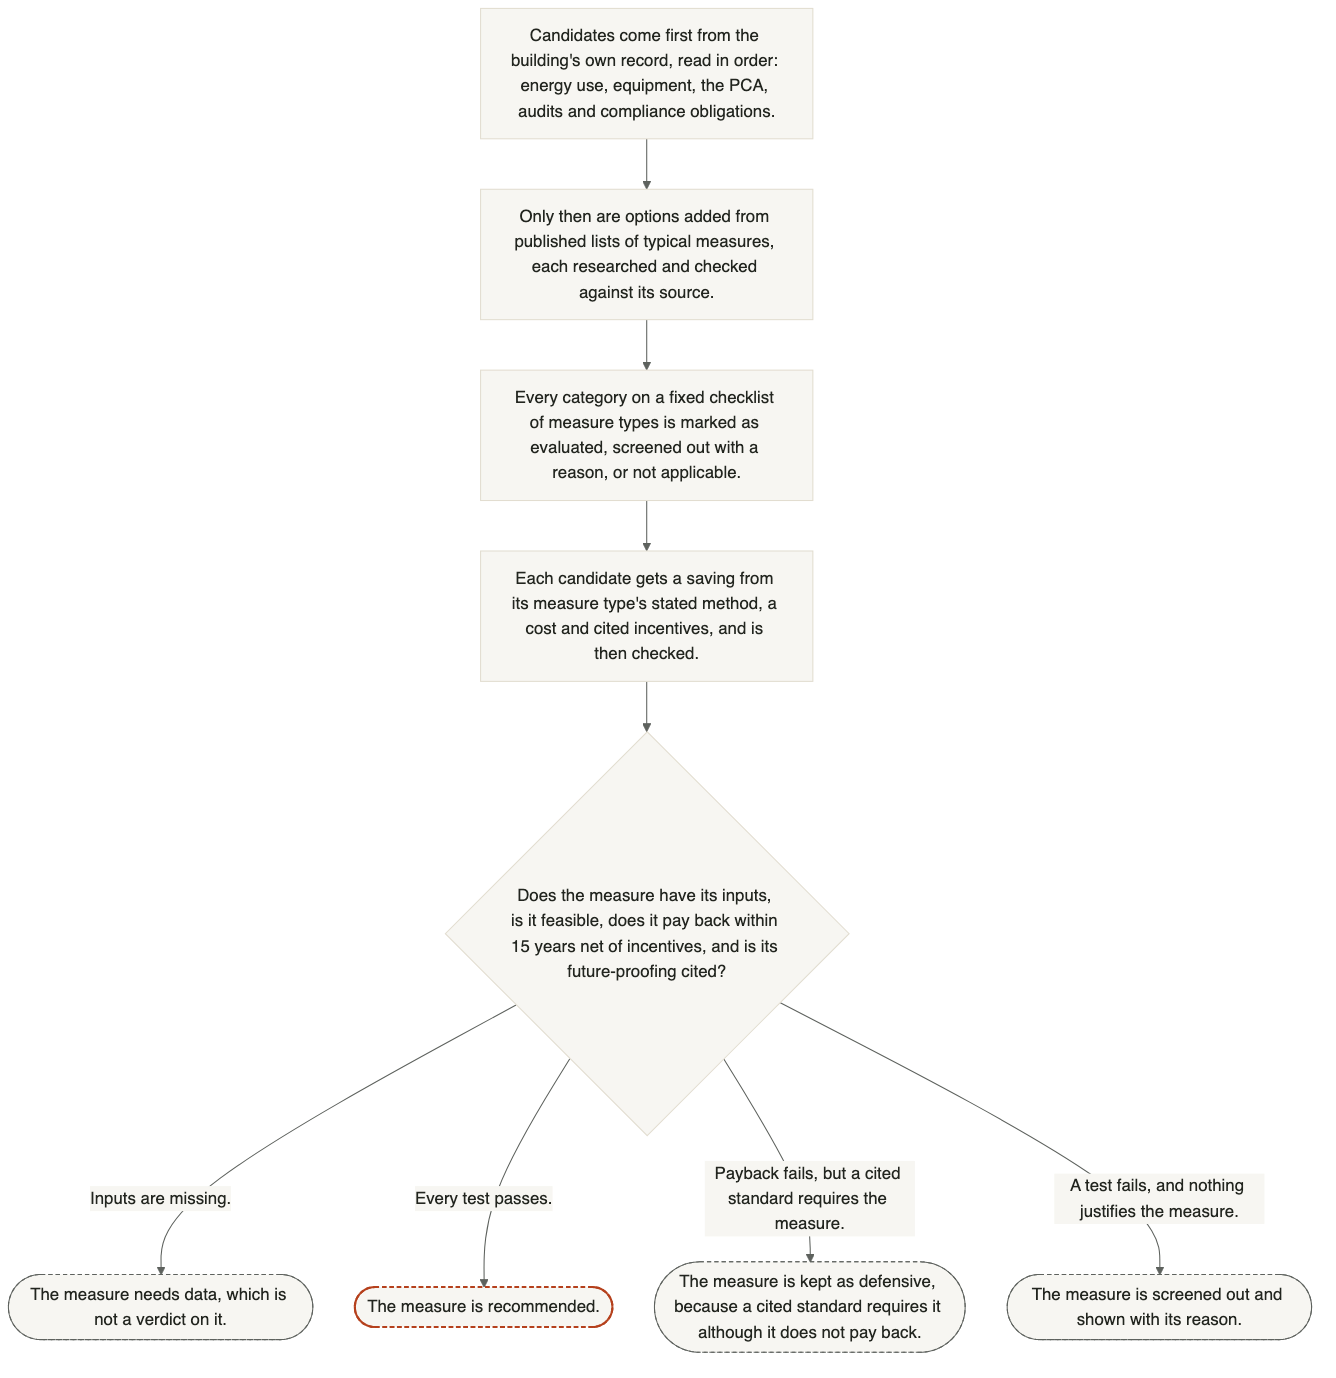
Measures come from the building's own record first, and then from a fixed checklist of every measure type. Each candidate is costed, given a saving by a stated method, and screened on value, feasibility and future-proofing.
The record is read in this order: energy use, equipment and its remaining life, the PCA, audits, and compliance obligations. Only then are published lists of typical measures consulted. Every category on the checklist of measure types, from the building envelope to how energy is bought, is marked as evaluated, screened out with a reason, or not applicable. A measure that an audit names is either kept or screened out with its reason.
The screen gives each measure one of four labels. A recommended measure passes the screen. A defensive measure does not pay back but is required or justified by a cited standard or regulation. A measure screened out is shown with its reason, and a measure that needs data cannot be judged until the data arrives. A measure passes the payback test if its cumulative savings repay its cost, net of incentives, within 15 years.
Figure 12 In a decarbonization plan, measures come from the building's own record first, and are then costed and screened. Open full size
Yes, a decarbonization plan is a capital plan. Each recommended measure carries a capital cost and an install year, and the plan shows capital, savings and carbon year by year.
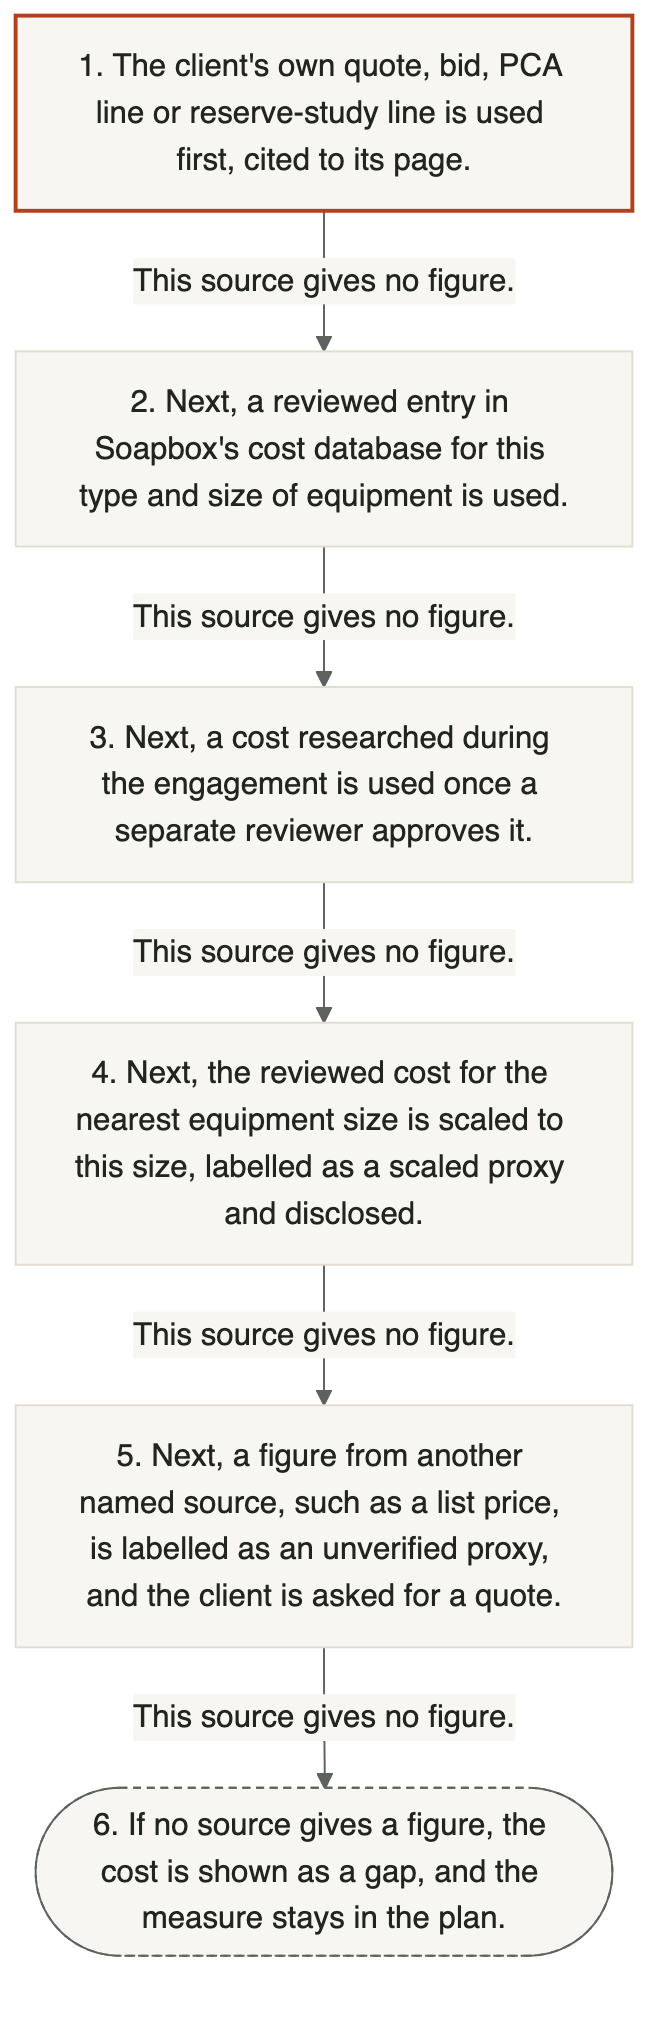
Each cost comes from the best source available, and the sources are tried in a fixed order of six levels, listed at the end of this answer. The client's own figure comes first. Next comes Soapbox's reviewed cost database, then costs researched and reviewed during the engagement, and then two kinds of labelled stand-in figure, called proxies. If no level gives a figure, the measure stays in the plan and its cost is shown as a gap. The report shows the source of every cost.
A cost is sized to this building, not taken as a lump sum. A database cost is a rate per unit, such as per square foot, per ton of cooling capacity or per piece of equipment, and it is multiplied by this building's quantity. The quantities, such as floor area, equipment capacity and the number of fixtures or units, come from the building's own documents, not from a rule of thumb. Where a quantity is not stated but its lowest and highest likely values are known, the cost is given as a labelled range between them. No cost is given without a quantity.
Each cost is then adjusted for location and brought to current prices, as Q24 describes. A cost that cannot be brought to current prices is not used.
Each cost is cited. A client figure is cited to its document and page, a database cost to its entry, and a proxy to its label and basis. An automated check rejects any cost with neither a calculation engine nor a cited source behind it. The quality review checks each cited entry, and it fails a cost outside the entry's own range or a cost taken from an entry for a different type of equipment (Q7).
These are planning costs, not bids, and they should be confirmed against local bids before a project goes ahead, because prices vary by region and contractor. A cost carries a low, a base and a high figure. Where its source gives a range, the low and high figures are the ends of that range, and where the source gives a single figure, all three are the same. Each plan states whether contingency and soft costs are included. In AACE International terms the costs are Class 5 estimates. They are Class 4 estimates where the equipment counts and capacities come from a PCA or drawings that the client provides (Q25).
The six source levels are tried in this order.
The client's own figure is used first. It can be a quote, a bid, a line in a PCA or a line in a reserve study for this building, and it is cited to its page. The engagement is based on the client's data, so if a lower level gives a different figure, the difference is reported rather than settled silently.
A reviewed database cost is used second. It is an entry in Soapbox's cost database that passed independent review and covers this type and size of equipment, adjusted for the building's location and brought to current prices.
A cost researched during the engagement is used third. It is researched from a cited source and approved by a separate reviewer before it is used, in the same way as a database entry. It exists because no database entry covered the measure, and once approved it is added to the database for later engagements (Q24).
A scaled proxy is used fourth. Where no reviewed entry covers this size of equipment, the reviewed cost for the nearest size is scaled to this size by capacity, labelled "scaled proxy" and disclosed with its basis.
An unverified proxy is used fifth. It is a figure from another named source, such as a manufacturer's list price or a published cost guide. It is labelled "unverified proxy", and the client is asked for a quote to replace it.
A gap is shown sixth, when no source gives a figure. The measure stays in the plan with its cost shown as a gap, and no number is entered by hand.
Figure 13 In a decarbonization plan, each cost comes from the first of six source levels that gives a figure, and the report names that level. Open full size
Every cost names its source level, from the client's own quote down to a labelled proxy (Q23). A cost that is not the client's own comes from Soapbox's reviewed cost database where an entry covers the measure, and otherwise from the lower source levels in Q23. Every entry in the database was researched from a cited source and passed an independent review before anything could cite it.
A cost is adjusted for location only by a cited location factor. In the US, the labor share of a cost is multiplied by the ratio of the local construction wage to the national one, from Bureau of Labor Statistics wage data, where that ratio is on record. Material, equipment and any share without a cited factor stay at national cost, and the cost is marked as having no local factor for that share. This differs from a location the pricing tool does not recognize at all, which gets no cost, because the tool cannot tell which factors would apply there. In Canada, a location is priced only where a cited location factor exists, and the cost is converted at the Bank of Canada annual exchange rate.
A cost is then brought from the year its source is priced in to current prices. The index used is the Bureau of Labor Statistics producer price index for nonresidential building maintenance and repair, at its latest published month, read from the reviewed reference library each time it is used.[41] A cost is stated in current dollars whatever year the measure is installed, and it is never inflated to a future install year, because the index publishes no forecast. If the index cannot be read, the cost is not used, and stored index values are never used instead. The quality review flags a recommended measure whose cost has not been brought to current prices, or was brought forward on an index more than a year old.
A cost is researched and reviewed in eight steps.
The reviewed database is checked first. Each likely measure's cost is looked up among the reviewed cost entries for its type of measure and equipment. This is done for the engagement's likely measures before any analysis starts, and again for each candidate measure (Q5).
A gap is researched next. Where no reviewed entry covers the measure, a research tool makes several targeted web searches and returns cited results with duplicates removed. The tool does not choose the answer or judge the source, because the next steps do that.
The researcher checks that the source states the number. The researcher opens the cited document and captures the sentence or table cell that states the figure, with its page, table or section. A source that cannot be retrieved is not a citation, and nothing is entered from it.
The finding is entered as a candidate, which no engagement can use until a separate reviewer approves it. The candidate records the type of measure and equipment, the value and its unit, and the quantity it is priced per, such as per square foot, per kilowatt, per ton, per piece of equipment or per project. It also records the citation, the kind of source, such as a vendor quote, a contractor bid or published cost data, a low and a high value where the source gives a range, the date the source gives, and who entered it. A cost found during an engagement is entered as a general fact about that type of equipment, never as that building's own cost, and an entry that identifies a client is rejected.
A separate database reviewer checks the candidate. The reviewer, which did not enter it, fetches the source and confirms that it states the value. It checks that the value is plausible for its type, unit and basis, so a cost in the wrong currency or per the wrong unit fails here, and it checks that nothing identifies a building. It then approves the entry, or rejects it and names the check that failed. A rejected entry is kept with its reason, so a later correction can be checked against it (Q5).
The cost is adjusted when it is used. When a reviewed entry is used, it is priced for the building's location and brought to current prices. An entry whose source states no price year cannot be brought to current prices until a recorded decision or the source page sets the year, and the entry's stored value is never changed.
The quality review checks every cost again at the end. It looks up the entry behind each cost a figure cites, and it fails a value outside the entry's own range or an entry for a different type of equipment (Q7).
If no reviewed entry exists, the cost moves to the next source level. That level is research reviewed within the engagement, then a scaled proxy priced from the nearest reviewed size, then an unverified proxy from another named source such as a list price. Proxies are labelled and disclosed, and an unverified proxy comes with a request for the client's own quote. If no source gives a figure, the measure stays in the plan with its cost shown as a gap, and no number is entered by hand (Q23).
The plan's costs are Class 5 estimates, the screening class in AACE International's estimate classification for building construction, Recommended Practice 56R-08. They are Class 4 estimates where the equipment counts and capacities come from a property condition assessment (PCA) or drawings that the client provides. Exhibit 1 below sets out all five classes and their expected accuracy.[42]
AACE sets the class mainly by how far the project has been defined. A plan is written before any design for its measures exists. A database cost priced per square foot, per ton of capacity or per piece of equipment, and multiplied by the building's documented quantity, is the factored, parametric method that AACE lists for Class 5 (Q23). Where the client provides a PCA or drawings and the equipment counts and capacities come from them, the cost is built up from the building's own equipment, one piece at a time. That is the parametric, assembly-based method of Class 4.
The accuracy ranges describe the class, not a measured accuracy of Soapbox's costs, and they are separate from the low, base and high figures shown with each cost. A cost taken from the client's own document, such as a contractor's bid, takes the class of that document. A measure moves beyond Class 4 only when design work is done for that project, which is why the plan's costs should be confirmed against local bids.
AACE's companion practice for the process industries, 18R-97, gives wider Class 5 ranges (-20% to -50% low and +30% to +100% high). It states that it does not cover commercial building construction, so 56R-08 is the practice that applies.[43]
Exhibit 1The plan's costs are Class 5 estimates, and they are Class 4 where a PCA or drawings provide the equipment counts and capacities.
AACE International RP 56R-08 estimate classes, Class 5 to Class 1
Class
Maturity (% of project definition)
Typical use
Typical method
Expected accuracy (low / high)
Class 5 Plan costs, by default
0% to 2%
Functional area, or concept screening
SF or m² factoring, parametric models, judgment, or analogy
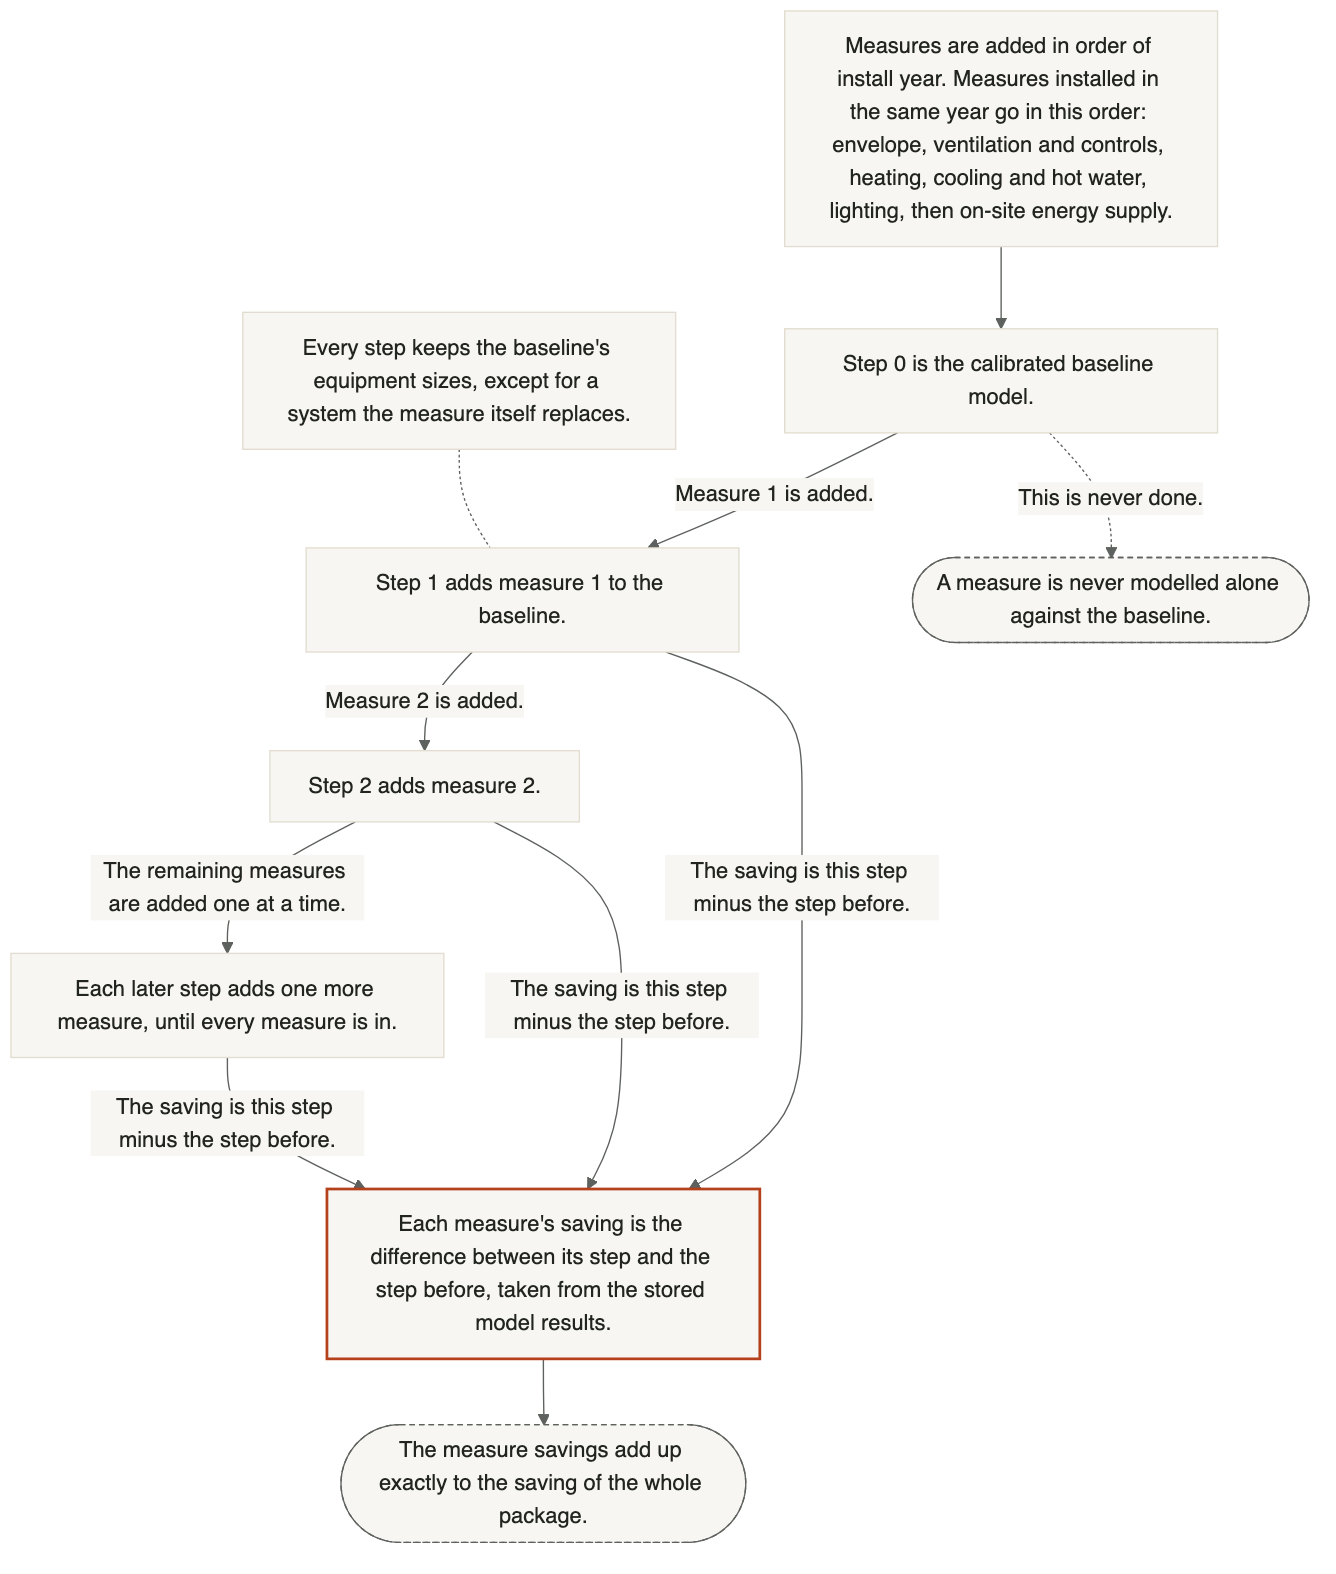
Measure savings are never estimated one by one and then summed. Where a building is simulated, each measure's saving is the extra saving it adds to a model that already contains the measures before it, so the separate savings add up to the saving of the whole package. Savings stated as percentages are compounded, never added.
Measures are added to the calibrated model one at a time in order of install year. Measures installed in the same year go in this order: the building envelope, then ventilation and controls, then heating, cooling and hot water, then lighting, and then on-site energy supply such as solar. Each step keeps the baseline's equipment sizes, except for a system the measure itself replaces, so no saving comes from resizing equipment that the measure did not touch.
Where lighting is not simulated, its standard formula still includes the effect of lighting on heating and cooling.[3][18]
Figure 14 In a decarbonization plan, each saving is the step a measure adds to a model that already holds the measures before it, so the savings add up to the package. Open full size
Where the building is modelled, a measure's saving is the step it adds to the model calibrated to the bills. Otherwise the saving comes from a stated method with cited inputs. Reports show the basis of each figure, such as modelled or screening estimate.
A measure that the engine can simulate takes its saving from the building's calibrated model, and an audit's figure for that measure is used only as a plausibility test.
A measure that the engine does not simulate, such as exterior lighting, uses the stated method for its type. For lighting, the saving is the connected load times the hours of use, adjusted for the effect of lighting on heating and cooling. For fans and pumps, the saving follows the standard relationship between speed and power. For water heating, the saving compares the useful energy delivered. The inputs come from reviewed database entries or cited research, never from memory.[2][3]
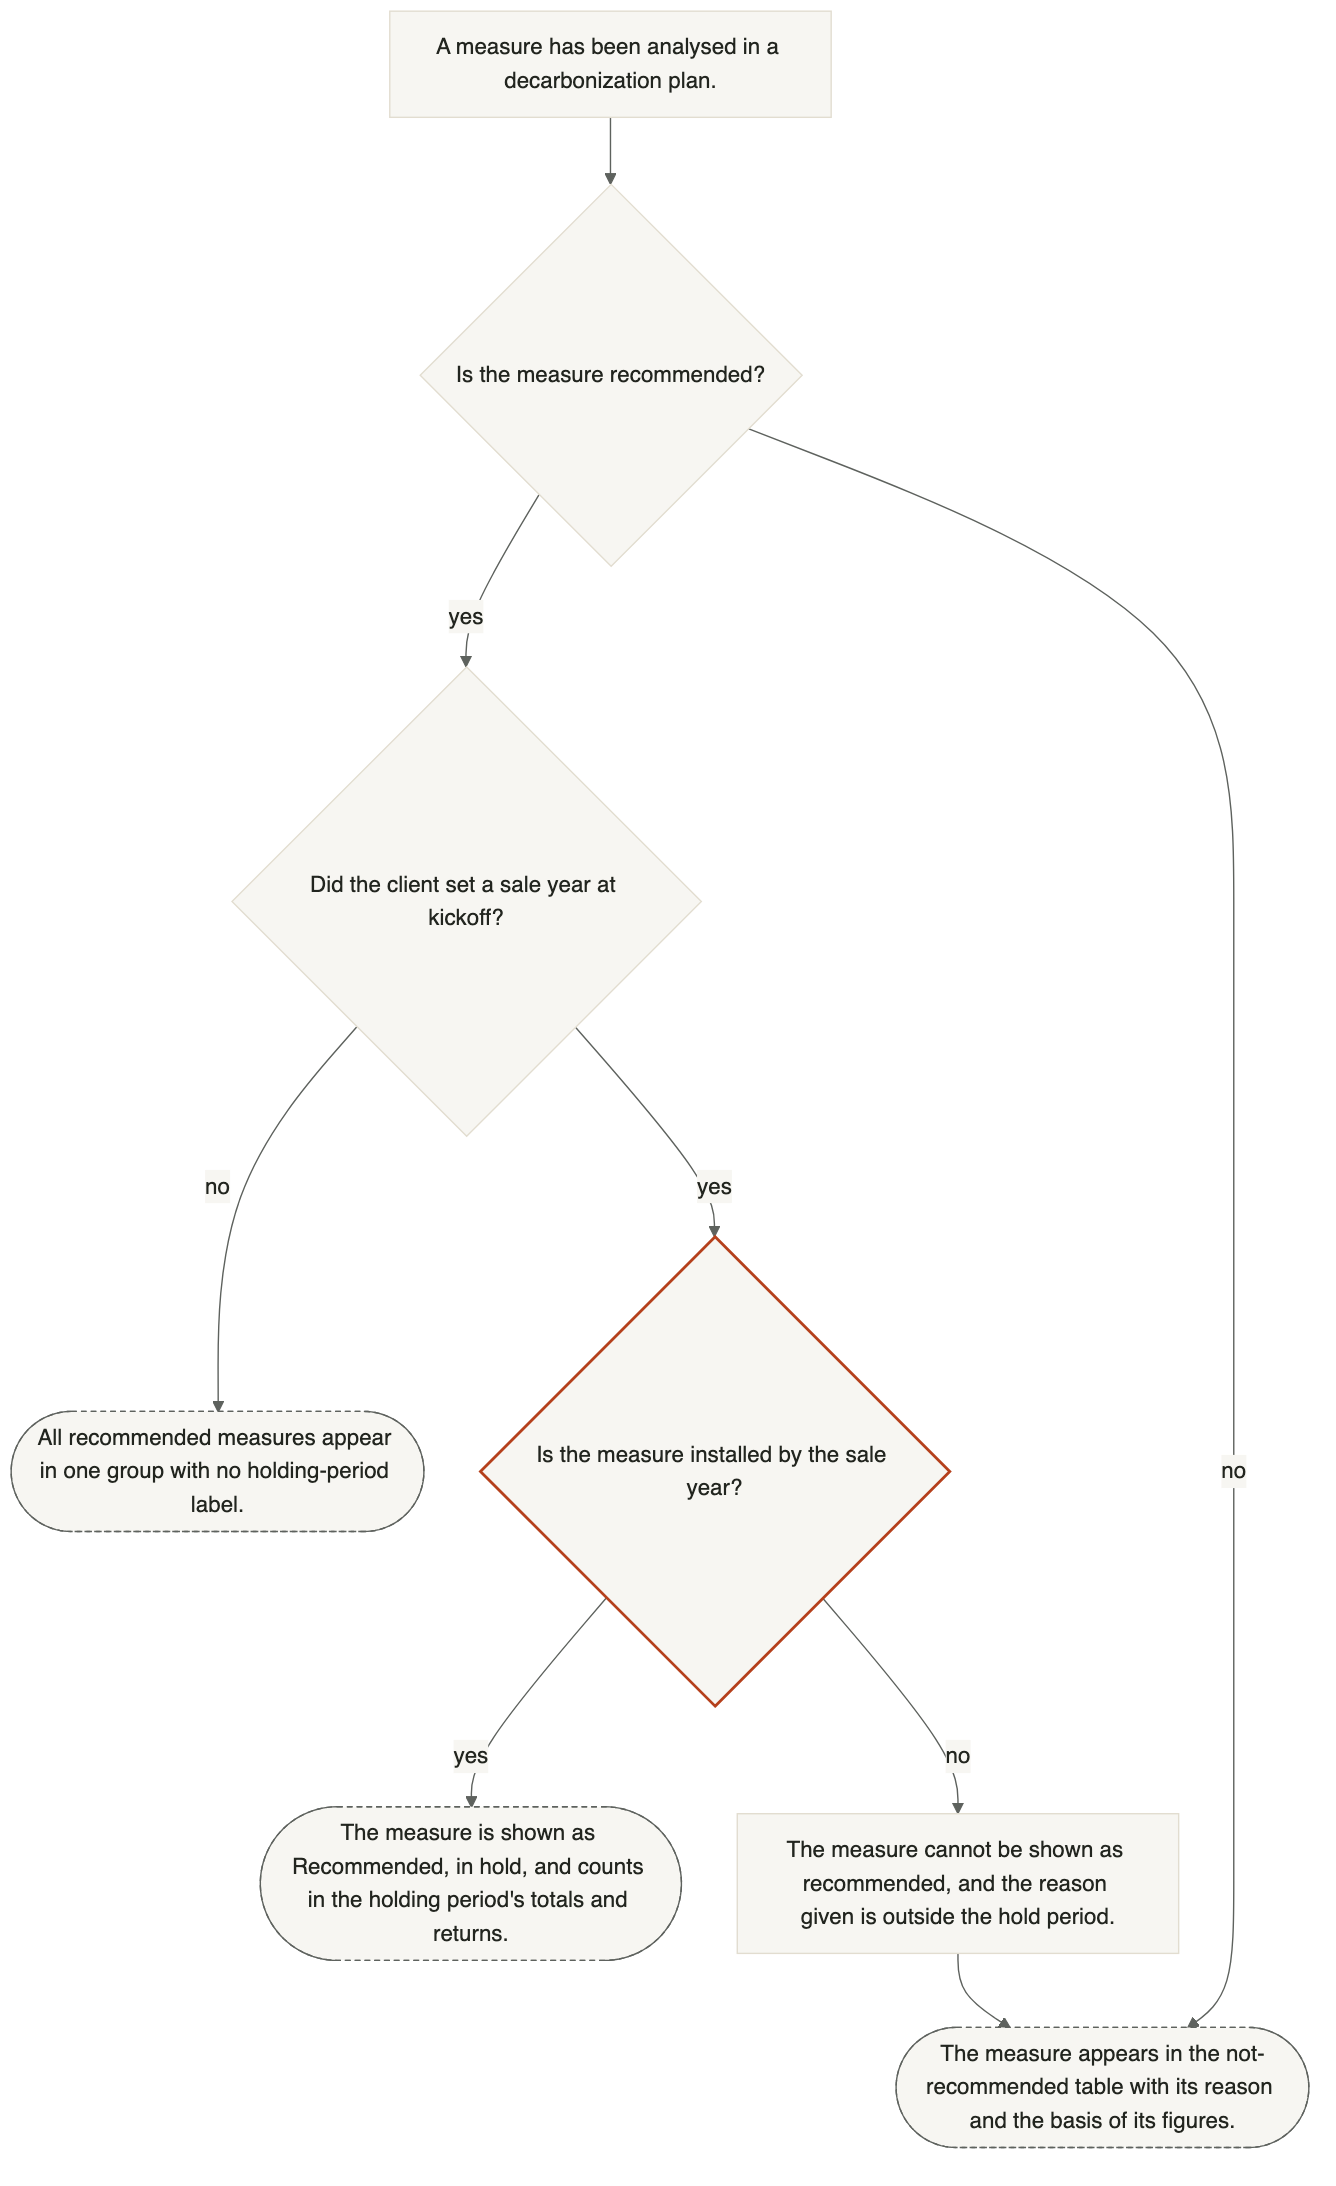
The analysis decides which measures are recommended, and the report template sets what figures a recommended measure must carry and how it is shown. In a decarbonization plan, for example, a recommended measure must be installed by the year the building is sold.
A recommended measure carries every cost, saving, incentive and revenue figure. A missing figure is researched, it is shown as a gap until it is found, and it is never a reason to drop the measure. A zero states its basis.
When the client sets a sale year, recommended measures are shown as "Recommended, in hold" and count in the totals and returns for the holding period. A measure installed after the sale is shown as not recommended, with the reason "outside the hold period". Not recommended means that the measure was analysed and is not advised, and each such measure is shown with its reason and whether its figures are modelled or a screening estimate.
Figure 15 In a decarbonization plan, the holding period decides whether a measure is shown as recommended, and the template rejects a recommended measure installed after the sale. Open full size
Each is a separate, cited line in the cashflow. Each incentive, rebate and tax credit enters the cashflow as its own line, named to its program, rather than being netted into the cost. Changes in operating and maintenance costs are a separate line that can be positive or negative, and a figure nobody researched is never shown as zero.
Incentives are researched in five categories: capital grants, financing, tax, operations and revenue. Every dollar names its program and citation, and a zero is entered only with a record of what was searched.
A decarbonization plan, for example, caps the incentive it counts at 80% of the measure's cost and shows the excess as possible upside. The cashflow engine computes the repayment of an investment tax credit when the building is sold within five years, and a maintenance saving carries a cited figure in its source's price year.[19][17]
Part F
Money
This part explains how costs, savings and returns are computed, and who receives the savings.
The cashflow engine computes them from one cash flow per year, with no debt and no income-tax line; tax credits enter as incentives (Q29). NPV and IRR are computed on that cash flow, and payback is the year from which the undiscounted cumulative cash flow stays at zero or above. Each workflow sets whether figures are in real or nominal dollars.
Each year's capital, less incentives, is paid at the start of that year. If the cumulative cash flow dips below zero again later, payback moves to the year it recovers for good, and payback is never capital divided by first-year savings. Two IRRs are reported, one including the exit value (the value the savings add when the building is sold) and one without it, and NPV uses the engagement's discount rate, never the hurdle rate.
A decarbonization plan is in real dollars throughout, and its template rejects any other basis. A Deal Screen also runs in real dollars, and converts nominal rates using the ten-year breakeven inflation rate.[20]
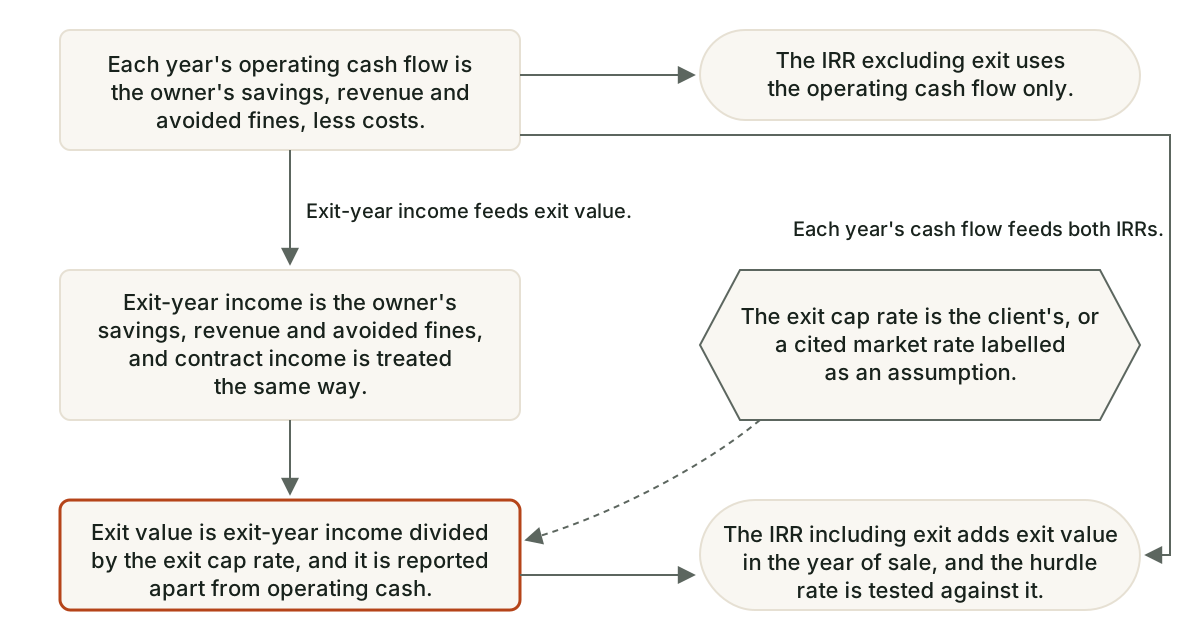
Exit value is the recurring owner benefit in the year of sale, capitalized at the exit cap rate, and it is reported separately from operating cash. The cap rate is the client's, or a cited market rate labelled as an assumption.
The cashflow engine capitalizes the owner's savings, revenue and avoided fines in the year of sale at the exit cap rate. Contract income and other income that lasts for a limited time are capitalized the same way, and are never valued as the remaining payments of a contract.
Two IRRs are reported, one with the exit value and one without, and the hurdle rate is tested against the IRR that includes the exit value.
Figure 16 Exit value is the recurring owner benefit in the year of sale capitalized at the exit cap rate, and it is reported separately from operating cash. Open full size
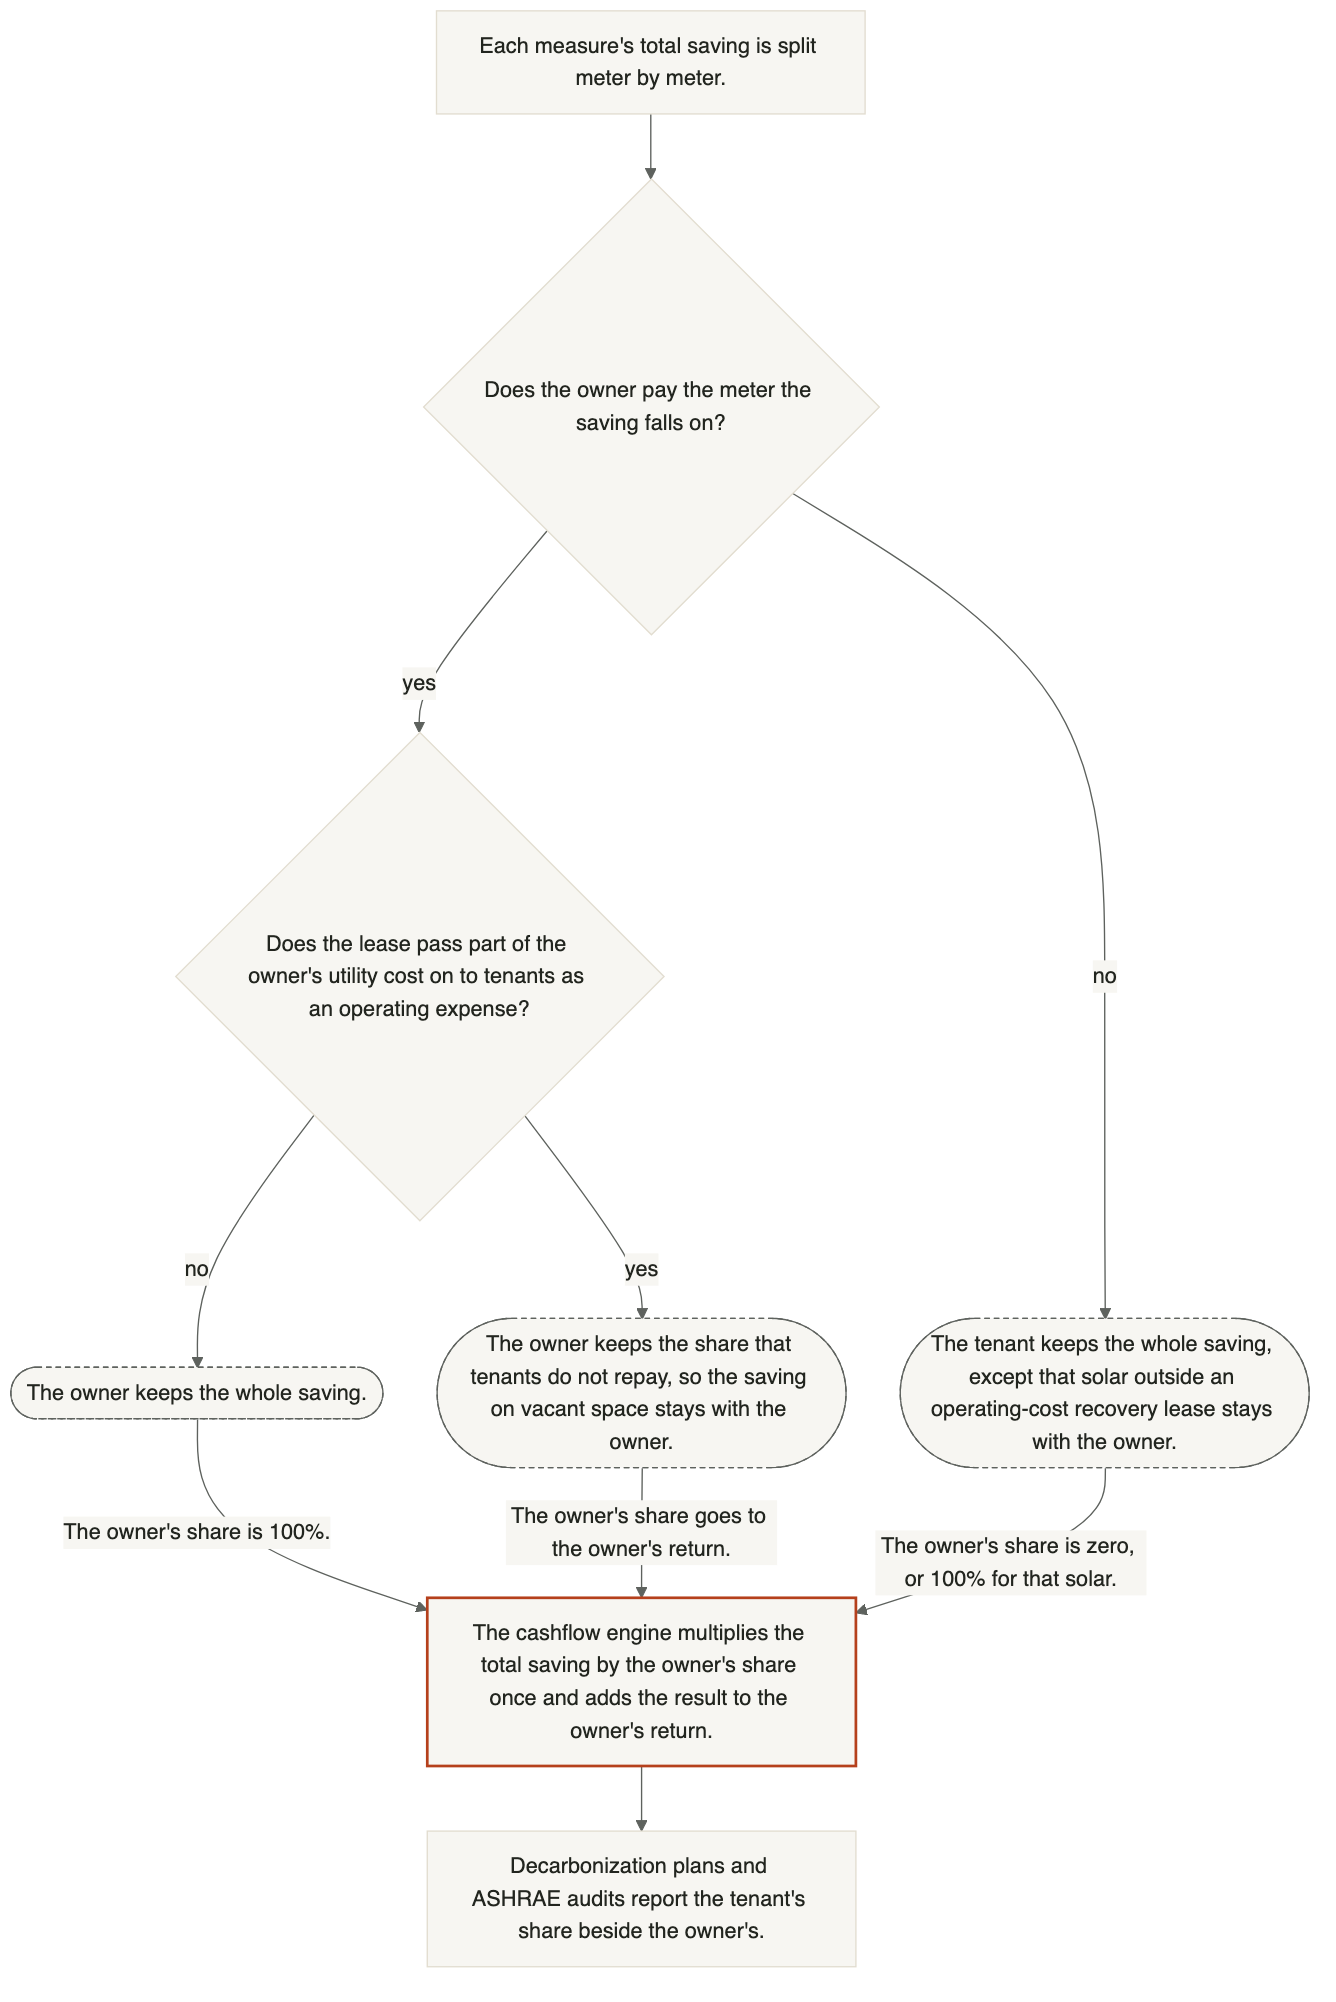
Each saving is split according to who pays the meter it falls on and what the lease lets the owner recover. The owner's return counts only the owner's share, and the tenant's share is reported beside it.
The owner's share comes from the cashflow engine, never from a rule of thumb, and the engine applies it once to the total saving. The share depends on the lease, the meter and the measure. A meter the tenant pays gives the owner nothing. On a meter the owner pays, a lease that passes operating costs through to tenants leaves the owner only the share that tenants do not repay, which includes the share for vacant space.
The lease is read before any pricing, and a default for a category of lease is never applied over a triple-net lease. Revenue that the owner earns is not split.
Figure 17 In a decarbonization plan, the meter a saving falls on and the lease set the owner's share, and the cashflow engine applies that share once. Open full size
The plan uses the building's filed tariff where one is on record, then a researched tariff, then the latest state average price from the US Energy Information Administration, and it labels each rate with its source. Each fuel's price rises along its own path.
The rates tool first takes a reviewed database entry for the utility and the building's rate class, then a researched tariff for electricity from the national Utility Rate Database, then the latest state monthly price. The latest state price is labelled as a live figure that has not been reviewed. Where filed tariffs exist but none fits the building's rate class, the tool lists them rather than substituting an average.
The cashflow engine raises each fuel's price from a base year, by a fixed rate or by a year-by-year index such as the real price path in the 2026 Annual Energy Outlook, and it never extends the index past its last year.[21][22][23][24]
Part G
Carbon and compliance
This part explains how emissions, on-site solar, CRREM stranding and building performance fines are treated.
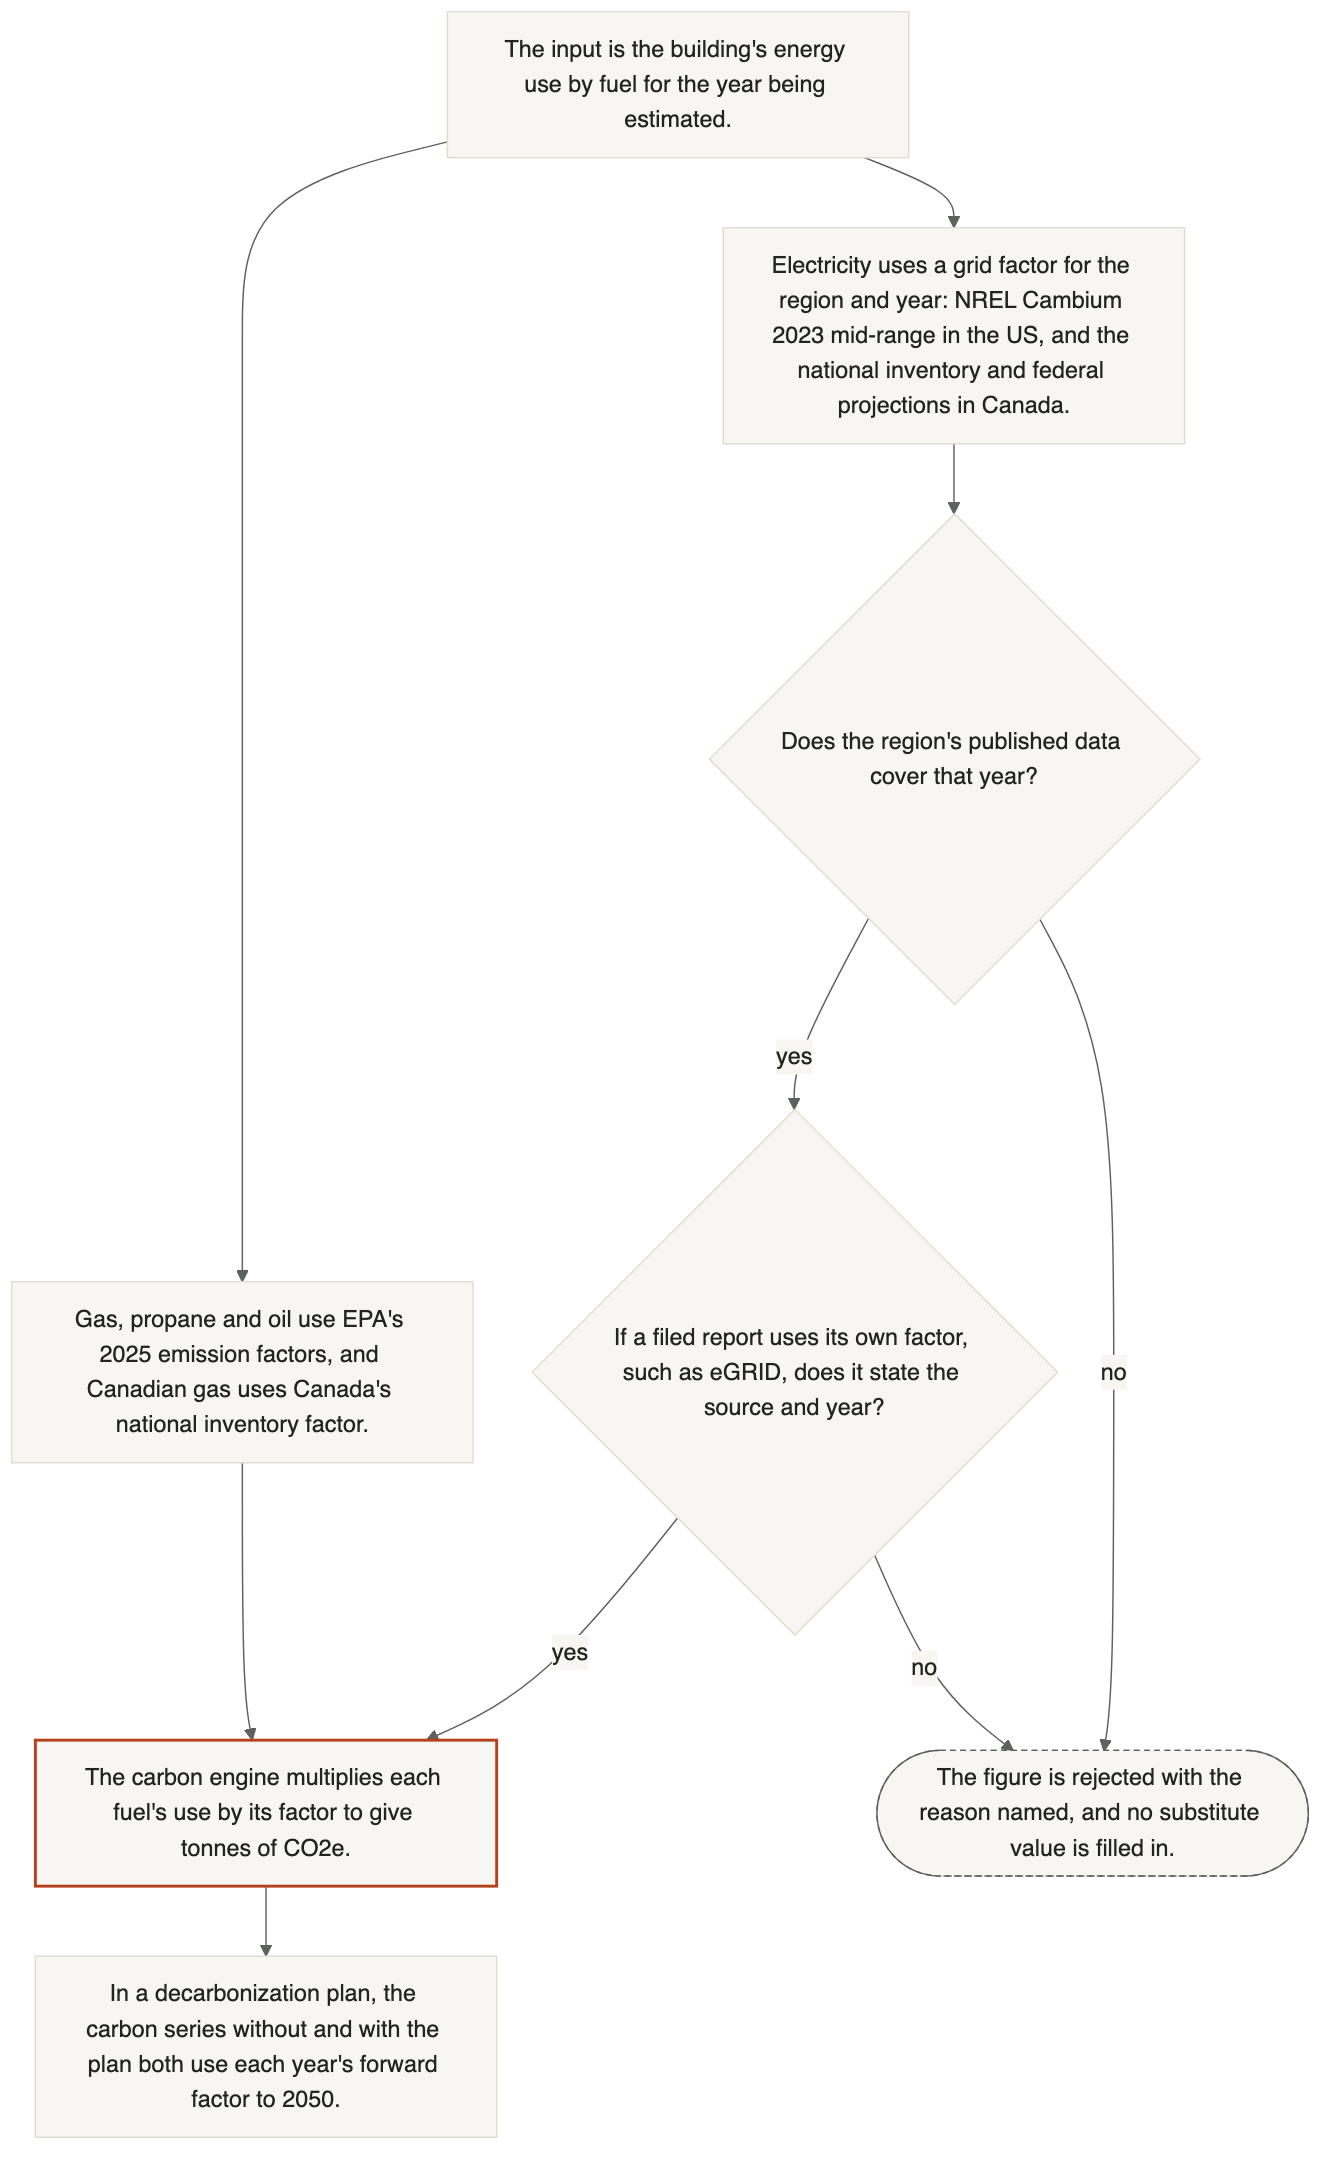
The carbon engine multiplies each fuel's use by a published emission factor. US electricity uses grid factors from NREL Cambium 2023, year by year to 2050. Gas, propane and oil use EPA's 2025 combustion factors, and Canadian gas uses the factor from Canada's national inventory.
US electricity uses Cambium's average emission rate for the building's grid region, from the mid-range scenario by default. A Canadian province uses national inventory factors and federal projections. US natural gas is 53.11 kg CO2e per MMBtu, the ENERGY STAR Portfolio Manager figure. A filed report's own factor, such as one from eGRID, is accepted only if it states its source and year.
Cambium publishes every fifth year from 2025, and the years in between are interpolated. In a decarbonization plan, for example, both carbon series, without and with the plan, use each year's forward factor to 2050.[26][27][28][29][30][31][32]
Figure 18 Tonnes are each fuel's use times its factor for the year, and a year outside the region's data or a factor without a source is rejected. Open full size
On-site solar is counted as an energy and carbon reduction, and it is credited toward a building performance standard only where that standard's rules allow. The owner claims the carbon reduction of the array whoever holds its renewable energy certificates (RECs), and the report says what became of the certificates.
When an owner's array exports power to community solar subscribers, the owner claims its carbon reduction whether the certificates are sold or kept, and the report flags certificates that were sold. Each line of generation states what became of its certificates.
The share of the solar power used on site comes from an hour-by-hour match against the load behind the array's meter. Solar counts toward a standard only where the standard's own provision allows it, and that provision is cited; otherwise compliance and fines exclude it. The CRREM stranding year stays based on the building's own use. A solar allocation uses only ways of selling the power that a filed tariff, statute or regulation sets out.[25][4][33]
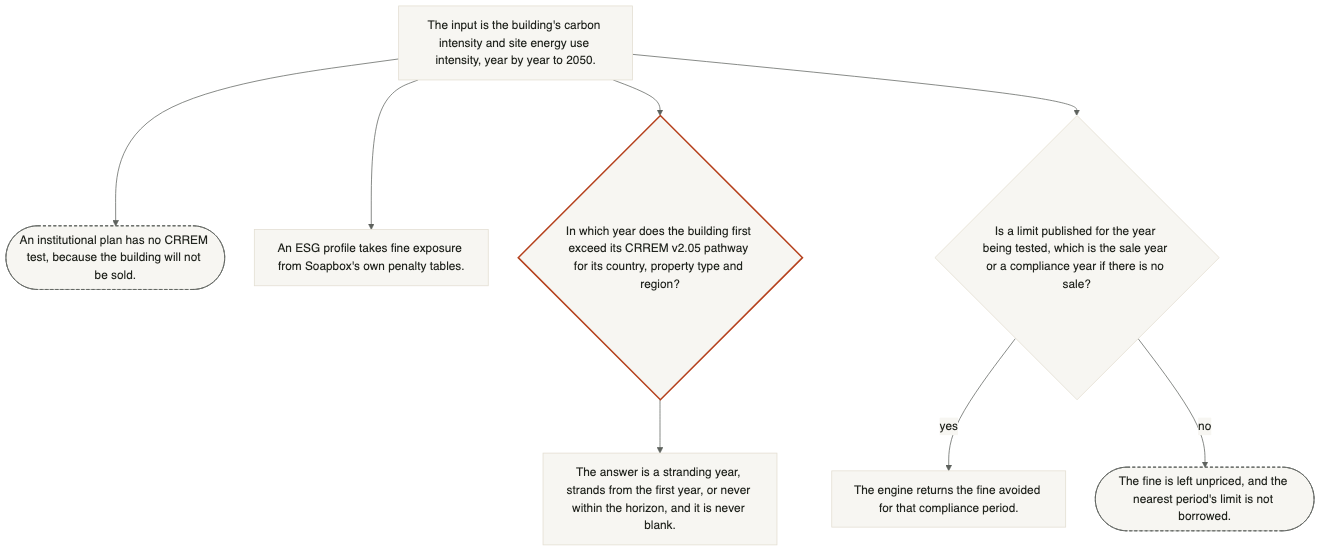
An engine compares the building's carbon and energy intensity with its CRREM v2.05 pathway in each year to 2050, and a separate engine computes fines.
The CRREM data is the v2.05 release of 30 April 2026. It is stored with checksums and compared each week with the release that CRREM publishes. Whenever the engine runs, it gives an answer: a stranding year, "strands from the first year", or "never within the horizon".
The fines engine prices one year, which is the year of sale where there is one and otherwise the compliance year asked about. For a carbon limit it uses only the limit the regulation publishes for the period that contains that year. If the year falls before the first published period, no fine is priced, because the building has no obligation in that year. If the year falls after the last published period, or in a gap between two periods, the fine is left unpriced rather than shown as zero, and the nearest period's limit is never borrowed. A standard set as an energy-use target is priced only against a target the user supplies, except in Washington, DC, where the fine is priced from the regulation's own standard for the compliance pathway chosen. The limit lines drawn on the charts state whether each limit is published by the regulation, derived from the building's own figures or supplied by the user, and which floor area it applies to, but a derived line is not used to price a carbon fine.[4][25]
Figure 19 The CRREM stranding year is never left blank, and a year outside every published period is left unpriced rather than given the nearest period's limit. Open full size
The method applies these standards: ASHRAE Guideline 14 for calibration, ASHRAE 211 for the Level II energy audit, ASHRAE 90.1, 62.1, 62.2 and 100 for code limits and targets, CRREM v2.05, the GHG Protocol's emission scopes, and the building performance standards that have been enacted.
The baseline engine reports the two calibration statistics, CV(RMSE) and NMBE, and a Guideline 14 verdict on every fit and calibration. The ASHRAE Level II audit is checked, before it is produced, against a structure built on ANSI/ASHRAE/ACCA 211-2018 (reaffirmed 2023), and its water fixtures are checked against EPA WaterSense rates.
A missing building input may be bounded by values transcribed from the tables of 90.1 (2007, 2013 and 2025), 62.1-2025, 62.2-2025 and 100-2024. Each value carries its table, its units and whether it is an upper or lower limit, and the edition used is the one the jurisdiction adopted. Emissions carry GHG Protocol Scope 1 and Scope 2 labels, stranding follows CRREM v2.05, and fines follow the standards themselves, such as New York City Local Law 97 and Boston BERDO.[2][1][34][35][36][4][37][38]
Part H
Auditing, data and limits
This part explains how a figure can be checked and where client data goes.
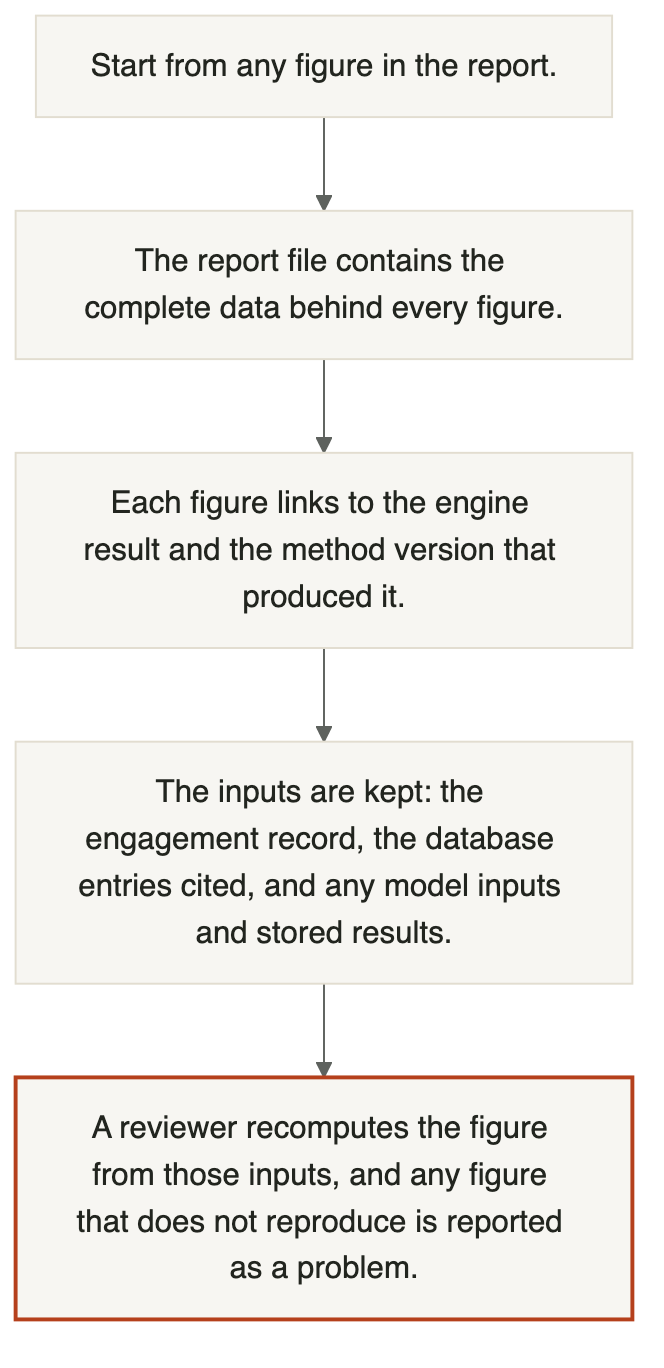
Every report carries the complete data behind it, the engines report the method version that produced each result, and the inputs are kept, so any figure can be recomputed.
A report is a single web-page file that also contains the complete data behind the page, so the numbers and their record travel together. The inputs are kept: the engagement record with its confirmations, the database entries the report cites and, where a building is modelled, the model's inputs and stored simulation results.
A review agent recomputes the figures from those inputs. In a decarbonization plan, for example, it also rebuilds the energy model and confirms that it is identical. A reissued report is filed as replacing the earlier one rather than as a second live copy.
Figure 20 Any figure in a report leads back to the inputs that produced it, and it can be run again. Open full size
A figure passes up to five kinds of check: its recorded source, the engine's own checks, a reviewer that recomputes it independently, the template's checks when the report is produced, and a person at set points. Which kinds apply depends on the workflow. In a decarbonization plan the checks run at seven points, which Q45 lists in order.
When a figure is first recorded, it carries its source, which is a cited document, a reviewed database entry or a labelled estimate. The engines then test their inputs. The baseline engine reports a Guideline 14 verdict, and the cashflow engine re-derives each dollar saving that is supplied with its quantity and rate, and flags a difference only when it is larger than both 2% of the saving and $25.
The reviewer recomputes the figures before the report is produced and checks the finished report afterwards, and a failure stops the report from being produced. Every report then passes its template's checks as it is produced.[2]
Client documents are stored on Google Cloud in the United States, and only members of the client's organization can reach them through the app. Soapbox does not use client data to train AI or machine-learning models.
Documents are kept in Google Cloud Storage in its US multi-region location. Every part of the app that belongs to an organization refuses a user who is not a member of that organization.
Two AI providers receive content. Anthropic runs the agents, and Voyage AI turns document text into a form used for search. Neither trains on that content: Anthropic's commercial terms forbid training on customer content, and the Voyage AI account has opted out of training. The databases shared across clients check every new entry for anything that identifies a client and reject an entry that does.
When an account closes, its organization's records and agent sessions are deleted after 30 days, and the record that the deletion happened is kept.[39][40]
Part I
Under the hood: the assumptions behind the numbers
This part covers the four topics a reviewer asks about first: measure selection, utility escalation, electrification and the grid, and the financial calculations. Each answer adds what the earlier answers do not say and links to them. Costs are covered in Part E (Q23, Q24 and Q25).
Measures are selected from the building's own record first and then from a fixed checklist of every measure type, as Q22 describes. This answer adds two points.
Where the client has its own list of measures, the report can show that list line by line, beside the plan's verdict on each line.
Every measure that switches fuel is paired with a high-efficiency alternative that does not switch fuel, such as a condensing boiler beside an air-source heat pump, and each carries its own capital cost and change in operating cost. A measure that raises operating cost is flagged, not hidden.
Where a building is simulated, savings are calculated in one cumulative model so they are never double counted (Q26), the evidence behind each saving is shown with it (Q27), and the report template sets how a recommendation is shown (Q28).
Each fuel's price rises along its own path, from its source rate, as Q33 describes. This answer adds two points.
In a plan stated in real dollars, a contract payment that rises in nominal terms, such as a price escalator in a power purchase agreement or a roof lease, is converted to real dollars with a general price index.
A Deal Screen tests a fixed set of three utility price scenarios, low, base and high, together with an early, base and late end of life for each major system. The set is fixed rather than chosen for each deal, because a set chosen for each deal could be used to make a deal look a particular way. Identical results across the price scenarios are treated as a data error, and a higher price path must cost more.
Electricity carbon uses a forward, year-by-year grid factor for the building's grid region, so electrified load gets cleaner as the grid does. Each heat pump is tested against the efficiency at which it costs exactly as much to run as the fuel it replaces, and the electrical service it needs is priced as part of the measure, not left as a footnote.
US grid factors are NREL Cambium's average emission rates for the building's grid region, from the mid-range scenario by default, year by year to 2050. Canadian provinces use national inventory factors and federal projections (Q34).[26] In a decarbonization plan both carbon series, without and with the plan, use the forward factor. A current-year average held flat in every year is not used, because it overstates future electricity emissions and is the most common cause of a false "already stranded" result.
For every fuel switch, the break-even efficiency of the heat pump is reported next to its modelled efficiency. The comparison uses the plausible range of the heat pump's efficiency, not a single value. If the whole range sits below break-even, the measure raises operating cost, and if break-even falls inside the range, the report states that the direction of the operating saving is undetermined.
Every fuel switch also carries the electrical demand it adds and whether the building's electrical service capacity is known. At screening it usually is not known, so the upgrade is priced as a range and flagged as unverified, and the quality review blocks a recommendation that presents an unverified service upgrade as firm.
Where on-site solar is in the plan, the energy bought from the grid is the modelled demand minus the on-site supply, converted to carbon with the same forward grid factor, so a solar measure is never double counted against a saving on the demand side (Q35).
The cashflow engine does the financial calculations, never the language model, as Q30 to Q32 describe. This answer adds three points.
Marginal abatement cost is what a measure costs for each tonne of CO2e it saves, and it is worked out separately for each measure. The cost is the extra capital the measure needs over a plain like-for-like replacement, counted for its first installation only, less incentives. Where the measure makes a later, planned replacement unnecessary, the capital that replacement would have cost is also subtracted. The cost of replacing the measure itself when it wears out is not counted. For a building that will be sold, the decarbonization plan divides that cost by the tonnes of CO2e the measure saves from its first year of savings to the year of sale, both years included, with the tonnes added up and not discounted. For a building that is never sold, such as a school, the plan divides the same cost by the tonnes the measure saves in one year, so its figure does not depend on a holding period. For a building that is never sold, the plan also prints a net figure: it subtracts from the cost the present value of the operating savings the measure makes until it would need replacing, and divides the result by the same one year's tonnes. The figure for a building that will be sold counts tonnes over several years, and the figures for a building that is never sold count one year's tonnes, so the two kinds are never compared with each other.
A sensitivity tool varies the exit cap rate and the growth in net operating income across a stated grid, and reports the spread of IRR and NPV as percentiles, with a chart that varies one input at a time. Every point is a real engine run, so it can be reproduced, and the tool is a fixed sweep, not a Monte Carlo simulation.
Exhibit 2 shows what goes into the cash flow and what comes out of it. Exhibit 3 shows the shape of one cash flow with illustrative round numbers.
Exhibit 2The cashflow engine turns its inputs into one cash flow per year and four results.
The cashflow engine computes every figure on one cash flow per year with no debt and no income tax, and the language model never does the arithmetic (Q30 to Q32).
Exhibit 3 · IllustrativeIn this illustrative cash flow, the year-0 outlay is recovered in year 4, and exit value arrives in the year of sale.
Capital net of incentives
Net owner saving
Exit value
Cumulative position
These are illustrative round numbers, not from any client or building: $750K of capital less $150K of incentives in year 0, a net owner saving of $150K a year rising 2% a year, and an exit value in year 7 equal to the year-7 saving capitalized at an 8% cap rate. The exit bar is cut off at the top of the scale, and the cumulative line excludes the exit value.
Part J
The QA/QC workflow
This part explains how a result is checked before it is filed, the data problems the checks are built to catch, when a result should be questioned, how far it depends on missing inputs, and what the method cannot do.
In a decarbonization plan the checks run at seven points, from the knowledge the work draws on to the file that is delivered. Other workflows run some of them (Q39). Each is a check that runs, not an instruction, and a failure sends the work back to be fixed and checked again at the same point.
First, the reviewed database is checked for what the engagement needs. It is checked for the engagement's locations, measures and methods, every gap is researched, and a separate database reviewer approves or rejects each finding before anything cites it (Q5).
Second, every document is accounted for. Every document on the building is logged as read to its last page, or set aside with a reason, before any fact may be reported as missing (Q17).
Third, the engines check their own inputs and results. The baseline engine reports a Guideline 14 verdict, and a failed baseline is not used (Q19). An automated check rejects any cost, saving or incentive figure that has neither a calculation engine nor a cited source (Q7). The cashflow engine re-derives each dollar saving from its quantity and rate (Q39), and each estimated input is given a status (Q47).
Fourth, a person confirms the key decisions. The terms were already confirmed before the work started, and at this point a person confirms the baseline, the ranked measures and roadmap, and the executive summary before the work moves on (Q6).
Fifth, an independent reviewer recomputes the figures. The reviewer re-runs the cashflow, rebuilds the energy model and confirms that it is identical, and looks up every database entry that a figure cites to check its value and its type (Q8). A failure stops the report from being produced, and a checklist of the report's data must then clear before the report is produced.
Sixth, the report must pass its template's rules as it is produced. The engine will not produce a report that breaks any of its template's rules (Q10).
Seventh, the finished report is checked as delivered. The reviewer checks the delivered pages themselves, and a final check reads the visible text for the required disclosures, the headline figures against the data, and the table totals. If that check cannot run, the report is held, and only the report exactly as the engine produced it is filed (Q10).
The most common issues include bills that cover less of the building than they appear to, meters that overlap, billing histories with missing months, documents that disagree, and models that match the total bill for the wrong reasons. Each issue in the list below has a check built for it.
Owner-paid bills are often mistaken for the whole building's use. Where tenants or residents pay their own utilities, the owner's bills cover only common areas and vacant units. The baseline engine refuses to treat such data as the building's baseline, because the total is correctly added up but leaves out the entire tenant load (Q16).
Meters overlap. A whole-building meter already contains the common-area and tenant meters beneath it, so the engine reports which meters may be added together, fuel by fuel, and deliberately reports no total.
Billing data has gaps and partial months. The newest month of a billing export is often partial and is dropped, and a billing period with missing months is flagged. Each fuel's billing period is chosen separately, because fuels are not billed on the same calendar, and a month missing for one fuel would otherwise read as zero.
What a meter covers can change partway through the history. A change in the number of meters means that the metered area changed, so a step in consumption is flagged as a change in coverage, not in behavior, and the later period is used as the baseline (Q21).
Floor area is often stated without saying whether it is gross, rentable or conditioned. The basis is recorded for each building rather than assumed to be gross (Q17).
Documents disagree with each other. Both figures are kept with their citations, and the disagreement is reported and never settled silently (Q15).
Audit figures sometimes fail their own arithmetic. A measure stated in a client's audit or consultant report is checked against its own arithmetic before it is screened.
Earlier Soapbox reports turn up in the data room. An earlier Soapbox report is never used as evidence and is not counted when documents are accounted for (Q7).
A model can match the total bill through errors that cancel out. A model can match the total bill while one fuel is far too high and another far too low, so checks compare each fuel's modelled end uses with that fuel's own bills. On one building the annual total was within 7% of the meter while space heating was 19 times too low.
Sensitivity is measured, not assumed. Each estimated input is given a low and a high value, each from a source, and the model is run at both. The input counts as material only if the recommendation changes. A material input keeps the work running on its more cautious value and produces one request to the client for the document that would settle it.
Every value that did not come from a document is recorded in a list of estimated inputs. The list records the source each value came from, the citation behind it, a low and a high value each with its own source, whether its plausibility check was set before the answer was known, and whether it is material. A decarbonization plan prints this list as a table of estimated inputs in its Basis and Assumptions section.[5][6][8][9]
The test of materiality compares the list of recommended measures and their ranking at the low and high values, not a single figure. The input is immaterial if the same measures are recommended either way, no measure crosses the payback screen or the IRR hurdle, and no compliance status changes. The more cautious value is then used and disclosed.
If the recommendation changes, the input is material. The more cautious value is used so that the model still runs, the input is marked as needing data, and one request goes to the client. The request names the document, the fact it would settle and the measure that depends on it.
The more cautious value is chosen for each measure, not for the whole model, because the low and high values often pull in opposite directions. A lower lighting power density, for example, shrinks the lighting saving but adds heating load, which makes heating measures look better. Plug load, the power drawn by equipment plugged into outlets, works the same way: on one building a 19% cut in plug load produced a 75% rise in heating.
A gap affects the measure, not the whole engagement. A floor that nobody can describe holds up the floor-insulation measure while it is researched, but not the lighting, the hot water, the controls or the report. Missing bills follow fixed rules: with 6 to 11 monthly bills only a provisional fit is allowed, and with none the model is built from the documented characteristics and compared with similar buildings (Q16).
A kickoff answer that takes a default carries the default and its basis, and the report shows it as an assumption (Q13). On the financial side, a fixed sweep of the exit cap rate and the growth in net operating income shows the spread of returns (Q44). A Deal Screen shows capital as a range across an early, base and late end of life, never as a single line (Q42).
A result can be questioned whenever a figure rests on something weaker than a measurement. The cases below are the ones the method itself flags, in the report or in its internal review.
Question a saving that is small compared with the calibration tolerance. Guideline 14 calibration tests the whole-building total, and at the loosest monthly calibration it accepts, a measure that saves 5% of the building carries an uncertainty larger than the saving itself.[2]
Question a heat pump near break-even. Where the break-even efficiency falls inside the plausible range of the heat pump's efficiency, the direction of the operating saving is undetermined (Q43).
Question an unverified electrical service. A fuel switch is priced with a range for the service upgrade when the building's electrical capacity is not known (Q43).
Question a measure that depends on an estimated input. Its standing is uncertain while the input is marked as needing data, until the requested document arrives (Q47).
Question a proxy cost. A cost priced as a scaled or unverified proxy is labelled and disclosed as such (Q23).
Question an incentive pending confirmation. An incentive calculated from a program's published terms, where the building's eligibility is not yet confirmed, is marked as estimated and pending confirmation.
Question a provisional or modelled baseline. A fit on fewer than 12 monthly bills is provisional, and a baseline with no bills is modelled and compared with similar buildings rather than calibrated (Q16, Q19).
Question a figure graded as typical for the building's age. In a Deal Screen each headline figure is graded by its weakest input, from "stated in the offering memorandum" down to "typical for a building of this age", and the grade is set automatically.
Question an effect that the model's geometry cannot see. Measures that depend on orientation, on the difference between perimeter and core spaces, on shading by the building itself or on timing are flagged where the model's simplified geometry cannot represent them.
The method states what it cannot do rather than filling the gap. These are the limits a reader should keep in mind.
Results assume typical weather. Simulations run on a typical-year weather file, and the bill fits are restated on the site's average weather over the last ten years. Results describe an average year, not a particular year and not a future climate (Q21).
Some inputs are estimated from public data. Without a site visit, missing building inputs come from public records, images, code values at the adopted edition, and ResStock or ComStock typical values for the building type and age. They are labelled and given low and high values, but they are not measurements (Q14).[8][9]
Each measure's saving is less certain than the total. Calibration confirms the whole-building total, not each measure, so a single measure's saving is less certain than the total (Q48).
The model's geometry is simplified. The energy model's zones are simplified, so it can miss effects of orientation, of perimeter and core spaces and of shading by the building itself, and the affected measures are flagged (Q48).
Regional cost factors are partial. In the US only cited labor factors are applied, for the states and cities that have one, so material and equipment are priced at national cost. In Canada only locations with a cited factor are priced (Q24).
The financial sensitivity test is partial. The sensitivity tool varies the exit cap rate and the growth in net operating income only. It does not vary capital cost overruns, and it is not a probability simulation (Q44).
Grid carbon factors are projections. Future grid factors use Cambium's mid-range scenario by default, and a different future grid changes future electricity carbon (Q43).
Electrical service capacity is usually unknown. Service capacity is usually unknown at screening, so service upgrades are priced as ranges (Q43).
Incentive eligibility may be unconfirmed. Programs are calculated from their published terms and marked as pending confirmation where the building's eligibility is not established (Q48).
The standards tables are incomplete by design. The transcribed standards tables do not hold every edition and table, and where one is missing, the limit is treated as a gap rather than borrowed from another edition (Q37).
Without whole-building data, no intensity verdict is given. Where only owner-paid bills exist and no whole-building source is available, no CRREM or building performance standard figure is calculated (Q16).
Notes
The standards, regulations, published datasets and methods the platform applies, numbered as cited in the answers. An answer with no note rests on no external standard.
ANSI/ASHRAE/ACCA Standard 211-2018 (RA2023), Standard for Commercial Building Energy Audits, ASHRAE / ACCA. 2018 (RA2023). Cited in Q37.
ASHRAE Guideline 14-2002, Measurement of Energy and Demand Savings (section 5.3.2.4), ASHRAE. Cited in Q18, Q19, Q27, Q37, Q39, Q48.
PNNL-23269, Enhancements to ASHRAE Standard 90.1 Prototype Building Models (DOE/PNNL prototype buildings), Pacific Northwest National Laboratory for the U.S. Department of Energy. Cited in Q13, Q47.
ANSI/ASHRAE/IES Standard 90.1, Energy Standard for Sites and Buildings Except Low-Rise Residential Buildings, ASHRAE / IES. Cited in Q13, Q14, Q47.
ANSI/ASHRAE Standard 62.1, Ventilation and Acceptable Indoor Air Quality, ASHRAE. 2025 (Table 6-1; other editions are treated as a gap). Cited in Q13.
The utility's filed tariff for the building's rate class, the serving utility / its regulator. the schedule in force, recorded at kickoff. Cited in Q33.
Enacted building performance standards (e.g. NYC Local Law 97, Boston BERDO 2.0, Washington DC BEPS, Energize Denver, Maryland BEPS, Building Performance Colorado), the enacting jurisdictions. each ordinance as enacted, by compliance period. Cited in Q35, Q36.
Filed instruments for each way of selling solar power (tariff sheets, tariff riders, commission decisions, statutes, regulations), the building's jurisdiction and utility. as filed, cited per mechanism. Cited in Q35.
AACE International Recommended Practice No. 18R-97, Cost Estimate Classification System – As Applied in Engineering, Procurement, and Construction for the Process Industries, AACE International. Rev. November 29, 2011, Table 1 and scope. Cited in Q25.